Previously we detailed what memory statistics you can view in a Kubernetes, along with the importance of each metric. Of particular note is the (file) cache, using “available” memory to optimize IO.
To demonstrate these container memory metric interactions, lets take a look at a Kafka broker container.
Introduction to the Kafka Broker JVM
Kafka is a message bus. Producers send it data, consumer read and process and use the data. The broker we’re looking at is a Java virtual machine (JVM). While every technology is different, Java has attributes and characteristics that are similar to many other technologies making it a good choice for a general example of these principles.
The RSS of the JVM can be broken down into two primary areas: heap and off-heap.
The heap is where all Java objects exist. As the heap gets full, garbage collection runs to clear unused objects. The heap size can grow and shrink, with boundaries controlled by the Xms (initial minimum heap) and Xmx (maximum heap). JVM heap size parameters like Xmx can be left off of the parameters. If this is the case the JVM uses a formula to calculate the max heap size. This is based on the total memory on the system, or the container’s memory limit. In our example case we are initially setting the Kafka Xms and Xmx both to 1G. Oracle recommends setting them equal to minimize garbage collection, although we’ll see the good and bad impact of doing that later.
In addition to the heap is “native” and “direct” JVM memory usage. Class metadata, metaspace, data structures, JIT code, thread stacks, etc. Things that are not touched or cleaned by the heap garbage collector. This area is not as straight forward to limit and control as the heap and its Xmx. Its size will vary greatly from JVM to JVM. In general, somewhere around 100–300MiB, or 20–30% of the heap, but your millage may vary.
Net is we observe around 1.1GiB of RSS for the JVM: 1GiB for the heap and around 100MiB for the native JVM.
Beyond the RSS is the file cache. The Kafka broker JVM stores the messages in (mostly) sequential files on disk, as the consumers are requesting the messages to be replayed sequentially. The file cache is critical to Kafka in order to keep messages (files or parts of files) in memory. Healthy Kafka deployments will have a constant stream of disk writes, but minimal disk reads. This signals the consumers are keeping up with the incoming data; the data read requests are being satisfied by the most recent data in the file cache memory.
If your consumers get behind enough that the data is no longer in the memory file cache, disk read activity will increase. Since disk reads have higher latency than memory, the consumers will in turn slow as they will be waiting for the reads. If your incoming data stream is large enough, the consumers may never catch up without interaction.
As you can see, getting the cache space right is critical! Other databases or cache heavy services can have similar requirements.
Basic Workload
For our initial workload, the Kafka broker container has been given a 1.563GiB request and limit. The incoming message rate here is very small, just a few thousand messages. Yet as we can see, most of the memory given to the container is “used”.
 Figure 6: Kafka Memory Usage, Xms 1G Xmx 1G, Minimal Workload
Along with the 1.118GiB RSS usage (orange), around 333MiB of file cache (red) is used by Kafka. The total (blue) or sum of the RSS and cache hovers around the limit, as expected. The working set (turquoise) active memory is a little below the total, around 1.321GiB.
Increasing the Limit
In order to illustrate the impact the limit has on memory usage, I’ve doubled the memory limit of the container. I also doubled the request (we’ll get into why later), although this does not impact the results in this case. Remember, request is used by the scheduler for the budget; the limit is used for the running of the container.
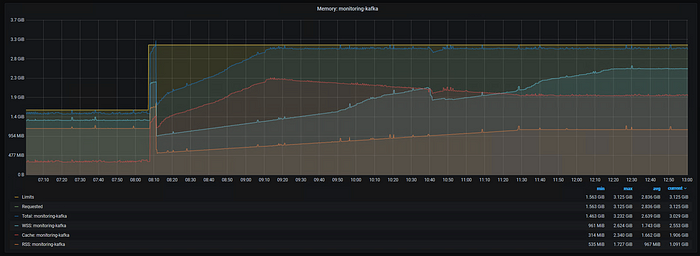 Figure 7: Kafka Memory Usage after doubling the limit, Xms 1G Xmx 1G, Minimal Workload
Note, the apparent spike in usage immediately after the change are a side-effect of the way statefulsets’ names do not change. During the switch, Prometheus is grabbing stats for the old and new container and summing them in this view. I’m not sure of a good way to hide this, but it can simply be ignored for now.
The workload here remained small, not stressing a production grade Kafka much at all (CPU is almost zero). Yet despite the tiny load, within an hour the cache and RSS have grown until the total usage has reached the limit again! If you increase your memory limit, given even a small load you are likely to fill your limit when caches are involved in the container.
After the total approaches the limit, the RSS is continuing to grow. Remember, the process has a 1G Xmx plus native JVM usage, so we expect it to grow until it’s again around 1.1GiB. The cache usage backs off as the RSS continues to grow, since the RSS has precedence. The kernel is working as designed, freeing cache to make room for the process’s RSS.
The working set also takes its time growing, not immediately consuming nearly as much as the RSS and cache. Eventually it levels off as well, again below the total, but by more this time. This pattern would suggest that while Kafka is able to “actively” use much of the cache memory to improve file IO, it’s not starved for memory and desperate for more cache space.
In the end, despite the same small workload, more memory (limit) results in more memory usage.
The Heap and RSS
After a little more than 3 hours the RSS levels off as well. At this point the heap has been filled and a major garbage collection is needed. Using a tool likeIBM’s Pattern Matching and Analysis Tool(PMAT) to analyze the heap usage and verbosegc data shows the internal details, as shown below. The first global compaction was around the 3 hour mark when the RSS leveled off. That is very infrequent for a JVM. After the compaction the tenured reset to just under 200MB.
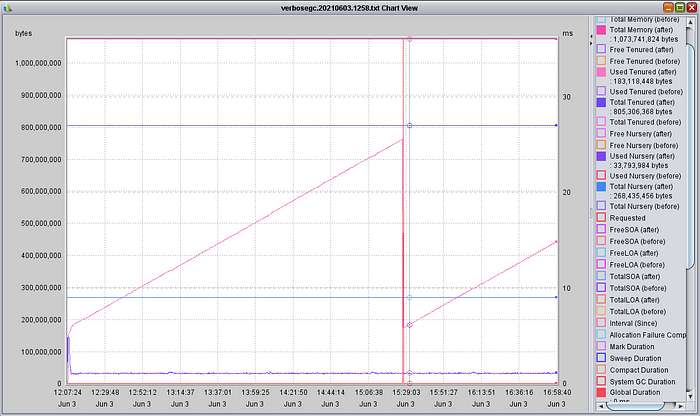 Figure 8: Kafka VerboseGC, Xms 1G Xmx 1G, Minimal Workload
Could the heap size be reduced? Certainly! Could you determine this from the RSS alone? Maybe. Could you tell it from the total? Absolutely not.
The long ramp-up time is suspicious, but inconclusive to confirm that the global garbage collection does in fact reduce the memory back down to much lower levels. This is why for development work, running with a small Xms often makes sense. In our case here we’ve forced the heap minimum larger than needed, as generally recommended for production.
Below is what happens if we change the Xms to a smaller value; in this case 64M. The JVM “Total Memory” (top pink line) is now between 300 and 400MB, although it is still growing. The grown is completely in the nursery (or new objects), not the tenured (purple). The tenured has entered into a nice saw-tooth pattern, leveling out at around the same 180MB as before. Yes, there are more global garbage collections, but they are still very infrequent.
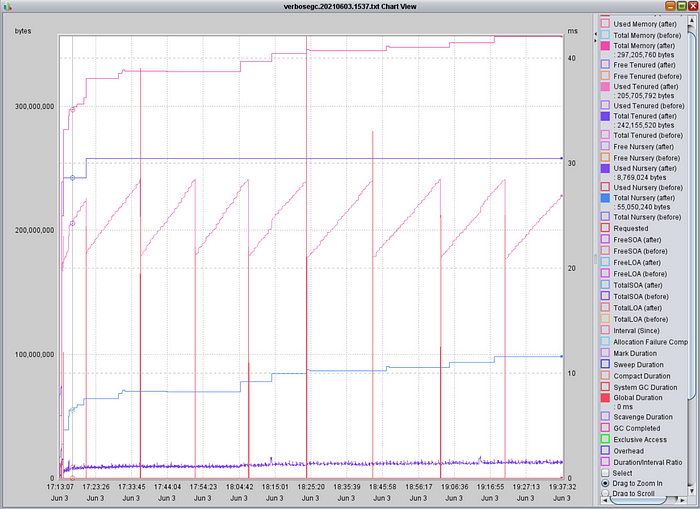 Figure 9: Kafka VerboseGC, Xms 64M, Xmx 1G, Minimal Workload
The RSS growth trend matches the “Total Memory” growth above (plus the native JVM usage). Because the Xmx is significantly more than the current heap usage, you may see the RSS continue to grow. Measurements and estimations could vary run to run, and results could be confusing if you do not recognize the impact of the Xms vs Xmx setting.
 Figure 10: Kafka Memory Usage, Xms 64M Xmx 1G, Minimal Workload
I personally do not have a problem with setting the Xms smaller than Xmx, especially in development environments. Even in production I see some potential value to this when done safely. For example, here we have a case where because the RSS is lower, more cache memory can be used. However, the potential to use more RSS (heap) is there and still have significant cache space. If you set the Xms and Xmx equal, your cache usage will be more consistent, but more limited.
The best answer will vary from case to case (and technology to technology), so be sure to analyze each case separately. Kafka’s global compactions are extremely infrequent and tenured usage very low. Other JVMs or situations will easily use up all of the Xmx you give it, regardless of the Xms.
The takeaway is technologies (like Java) will have similar memory behaviors to the file cache. You gave it RAM, it’s going to try to use it! When analyzing just how much memory a process or container needs, remember the RSS may be larger than “needed”.
Tuning Tuning Tuning
Building on the heap configuration, we can apply this general advice to memory:
In many cases, memory usage is based much more on the configuration and tuning than the actual workload rate.
This goes against the intuitive expectations people have on how memory sizing works. You may be okay with the idea that the cache uses up all of the available memory, but surely RSS is different? We expect a base usage, plus some delta based on how much load we generate. A process has a 100MB base, plus 1MB per workload unit. If you have 200 workload units, your memory is 300MB. 500 units results in 600MB. In many cases thankfully that is in fact how the memory works.
However, consider what often goes into the memory usage of a process. For example, you may have objects like a least recently used (LRU) cache. These are bounded by a max size. The workload stressing the LRU cache may increase or decrease. However, unless your code has logic to change the LRU max size, the cache will remain the same static size: the maximum.
Programs are full of these configurations and tuning parameters that can have drastic impacts on the memory size: thread count, cache size, queue size, etc… Your maximum memory potential is not reached until these limits are reached. After that, you’ve reached the max and level off (or at least for these key parts of the memory). If you do not plan for this maximum possible usage, you’re leaving the process open to the risk of running out of memory. And if you know you’re not going to stress it to the max, you must ask yourself why set the configuration that high in the first place? Safety first!
Excessive Limit Increases
Returning to the container as a whole, let's see what happens when we give the container an even larger memory limit.
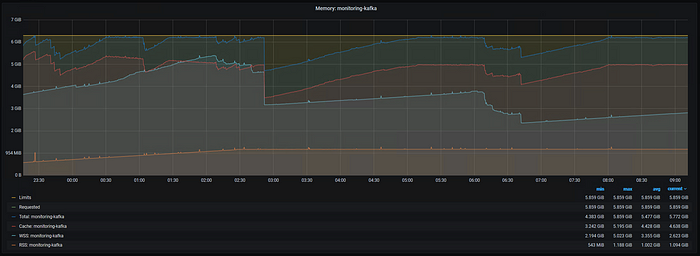 Figure 11: Kafka Memory Usage, Xms 1G Xmx 1G, 6GiB Limit, Idle Workload
As before, since the Xms and Xmx are reset to 1G each, the RSS grows to 1.1GiB. However, we have now given it more memory than it can use. The total is fluctuating, no longer pressed up against the limit. The working set is also fluctuating as there is not enough activity to keep the file cache active.
Applying a Workload
That’s enough idling, time to apply a workload!
After starting up thousands of messages streaming in and out each second, the working set takes off! Kafka is taking full advantage of the file cache to keep the GBs of streaming data in the memory. Note, the working set never does completely reach the total. In my experience you can expect around a 10% difference.
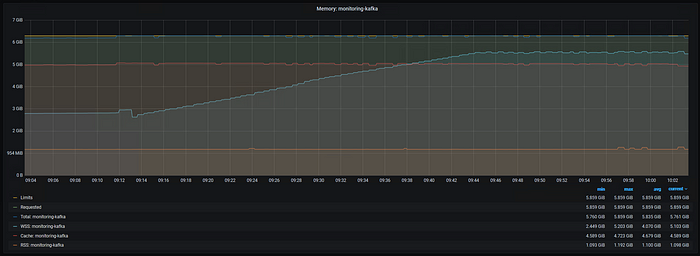 Figure 12: Kafka Memory Usage, Xms 1G Xmx 1G, 6GiB Limit, Moderate Workload Started
Not Enough Cache
Lets look at what happens when the cache is unable to satisfy all of the reads. For the first part of the graph, message ingestion and consumption is happening normally. No reads are required, since the data is still available in the cache. However, during this time I stop the consumers. Once the consumers start back up, the old data they need to access is no longer in memory in the cache. Reads (green) increase as the data must be accessed from disk.
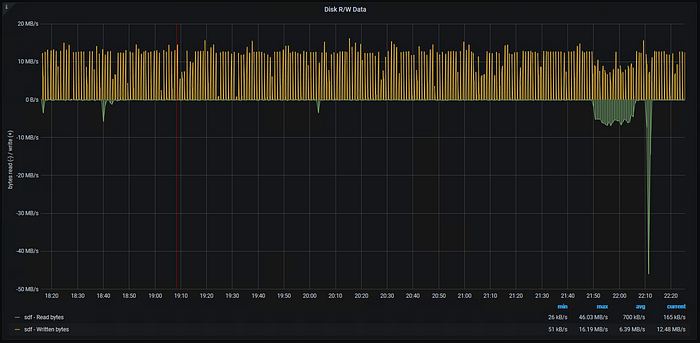 Figure 13: Kafka Disk Reads and Writes
Thankfully, in this case the consumers are able to catch up and the reads stop. However, it is possible in an environment that is not tuned well or using fast disks to never catch up if the reads cannot outpace the incoming data.
Limit Increases, Again
Finally, lets see what happens when we add even more memory to our Kafka container’s limit.
Previously we ran with a 6GB limit, but now lets try 10GB. For this test our moderate workload is adding around 20GB of on-disk data each hour, causing the file cache to quickly grow to fill the entire memory limit. Given the on-disk data is retained by Kafka for 4 hours, we’d need around 80GB of memory to hold all of the information in cache. The working set grows too, again reaching around 10% of the limit.
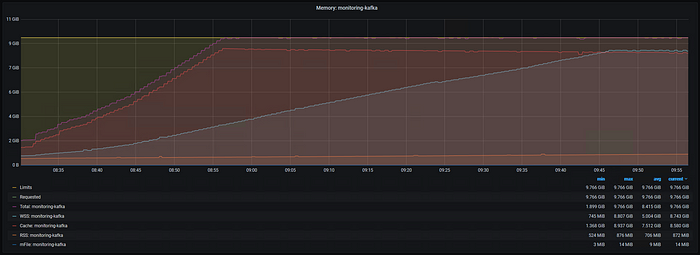 Figure 14: Kafka Memory Usage, Xms 1G Xmx 1G, 10 GiB Limit, Moderate Workload
When we change to a 20GB limit, the pattern repeats. Even though Kafka was perfectly fine with less RAM (no disk reads, keeping up well), the system will use whatever memory it has available for the cache.
Remember, Kubernetes generally uses the working set (WSS, active memory) measurement. Recognizing that the WSS can and will change based on your memory limit is crucial to measuring and sizing environments.
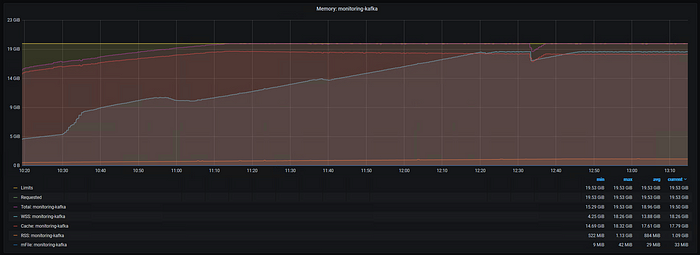 Figure 15: Kafka Memory Usage, Xms 1G Xmx 1G, 20 GiB Limit, Moderate Workload
To Be Continued…
Finally, we will be looking at some general recommendations and best practices that can be concluded based on this information.
#Kubernetes#rss#MEMORY#metrics#Kubernetes