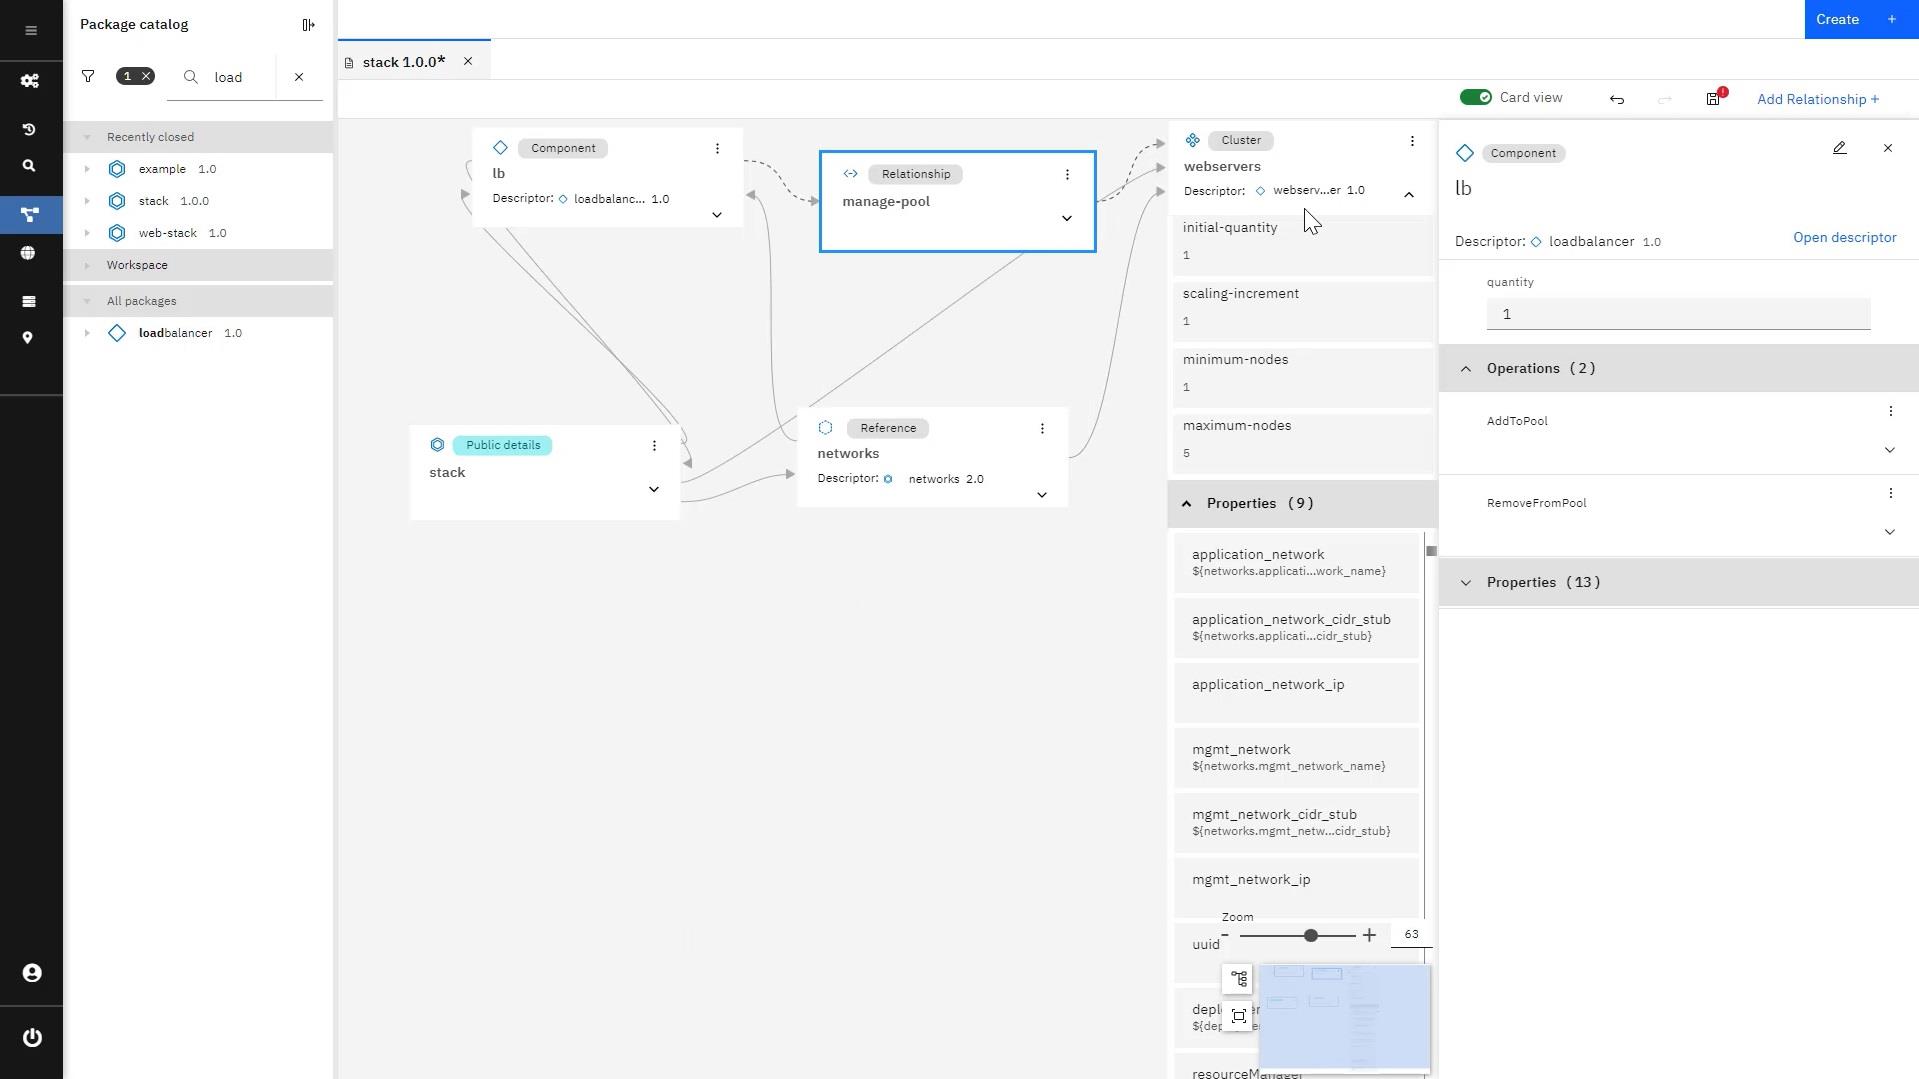
Watch the following videos to learn more about how to use the Designer tool to view, explore, and design new assembly descriptors and their components.
Overview of Designer tool in IBM Cloud Pak for Network Automation (2:43)
Creating a basic assembly by using the Designer tool Part 1 (5:25)
Creating a basic assembly by using the Designer tool Part 2 (5:13)
Multitenancy
You can now reduce operational expenses and use your infrastructure more effectively by running IBM Cloud Pak for Network Automation in multitenant mode. You can support multiple tenants from a single deployment of IBM Cloud Pak for Network Automation.
Each tenant is a collection of objects, including data. You can create tenants and assign user groups to them. Users in those user groups can access only the objects that the tenant owns. For example, users can access objects like these:
-
Assembly and resource descriptors
-
Assembly and resource instances
-
Deployment locations
-
SOL 004 and SOL 007 packages
Any objects that a user creates are assigned to the tenant associated with that user automatically.
Monitoring enhancements
New metrics
New orchestration metrics are added in this release to help you troubleshoot and monitor the performance of your system. For a full list of metrics, see Orchestration metrics.
Categorizing metric data
The metric data that is produced by IBM Cloud Pak for Network Automation microservices can now contain tracing tags that can be used to categorize intent requests. Categorizing the metrics that are produced by intent operations can be useful if you need to troubleshoot or monitor the performance of your system.
For example, if you have multiple client applications that are making REST requests to IBM Cloud Pak for Network Automation, you can now use tracing tags to group the Create assembly intents that are sent from each of the clients to check how much load that each client is putting on the system. You can then write queries in Grafana to generate charts to show the load from each application.
The following screen capture shows a Grafana chart that tracks the intents_total metric for each of the client applications.
Operational metrics dashboard
IBM Cloud Pak for Network Automation exposes operational metrics, which provide insight into the state, health, and performance of your orchestration environment.
You can now access a preconfigured dashboard in Grafana, which shows a default set of operational metrics. You can also create your own dashboard to show the specific monitoring and troubleshooting metrics that you need for your environment.
Logging request and response payloads for the Ansible® driver
If you are developing Ansible resource packages, you can optionally specify that request and response payloads are also logged.
Useful links
For more information about these features and other new features in this release, check out the What’s new topic in the IBM Documentation.
Transform your network with cloud and AI-powered automation, see Achieve zero-touch network operation with IBM Cloud Pak for Network Automation.