Amazon Elastic Compute Cloud (EC2) instances are virtual servers provided by Amazon Web Services (AWS) that grant users the ability to run their applications. According to Synergy Research Group, the top 3 cloud providers are Amazon, Microsoft, and Google who share a combined percentage of the market at 72%. Amazon is leading the pack with a 34% share of the market in Q3 of 2022.
There are very good reasons why worldwide cloud spend is expected to reach $592 billion in 2023—among them, Amazon EC2 instances deliver immediate scalability, heightened flexibility, and a simple deployment. Amazon EC2 is the most used AWS service and provides a wide variety of instance types for all different use cases. These instance types contain varying memory, CPU, networking, and storage configurations to give users different options to support the varying resource needs of applications. Each instance type has one or more instance sizes, allowing users to scale to meet ever-changing application demand.
The #1 goal of IT and Cloud Teams continues to be: assure application performance. If those apps don’t perform, then everything the cloud offers in terms of agility and operational efficiencies is moot. However, measuring Amazon EC2 instance performance can be a challenge. In this blog you will learn common approaches taken to measure and manage EC2 instance performance, both what AWS offers natively, as well as 3rd-party tooling that many users find helpful.
What’s required to effectively measure EC2 performance?
You can’t manage what you don’t measure. Measuring EC2 performance is key to assuring performance while also achieving cloud elasticity. You need to know exactly what resources an application requires to meet demand—providing great customer experiences—and continuously perform.
AWS EC2 provides basic metrics
AWS guarantees EC2 resource capacity and provides the following details about the hardware that EC2 instances run on.
- Compute
- Memory
- Storage
- IOPs/Throughput
- Uptime
- Discount Coverage
- Hourly Rate
- Region
Nevertheless, because of EC2 multi-tenancy, only capacity is guaranteed; performance is not. To that end, many users will leverage AWS CloudWatch or another monitoring tool for more detailed performance data on EC2 instances.
AWS CloudWatch gives more visibility in EC2
With AWS CloudWatch users get metrics on:
- CPU utilization percentage
- Disk usage
- Network
- CPU credit usage
- Status checks
- Auto-scaling group metrics
CloudWatch reports on these metrics in intervals of 5 minutes—or, if you upgrade, 1 minute. Any finer granularity past 1 minute is not available. CloudWatch’s visibility does not go past the virtual hardware layer causing certain levels of the applications performance to be missed. Overall, the metrics CloudWatch provides to users gives them insight into what’s happening with your instance, but no metrics are provided on the application itself.
Application performance metrics are required
IDC points out that, “…focusing on managing systems and applications to optimize the end-user experience is a major priority as fast performance and 100% uptime are table stakes for digital business success.” To that end, many Developers are looking to measure performance in ways that meaningfully reflect the end-user experience. Application observability tools, such as IBM Instana, provide this level of granularity that ensures you understand exactly what performance levels your end users are getting. Instana, for example, provides:
- Accurate real-time data
- Continuous, real-time discovery of microservices and infrastructure
- Powerful and easy-to-use data analytics
- Dependency mapping of “applications”
- Automated root-cause analysis of Service Level violations
Measure and manage EC2 instance performance—and drive elasticity
Measuring EC2 performance and application performance is critical to ensuring great end-user experiences. It’s also critical to consume the cloud responsibly. Immediate scalability is great, but if you’re only scaling up (or out) and not down (or back), then you’re missing out on cloud’s biggest promise: elasticity. No Developer or Application Owner is going to feel comfortable scaling down EC2 instances without understanding exactly how it will impact the performance of their application, which is often why elasticity has become a pipe dream for many organizations. AWS Compute Optimizer announcing support for 3rd-party APM tools is a testament to how important application context is for sizing down resources.
Dynamic demand requires equally dynamic cloud resourcing
For many organizations today, the cloud tools they are using still leave them stuck in a break-fix cycle. AWS EC2, for example, will alert you by email when an issue occurs. Then it is up to you to stop what you are doing and solve the issue. What if you didn’t have to wait for things to break? And what if the same platform that prevented performance issues, also gave you and your AppDev teams the data they need to feel comfortable about software automatically scaling down resources for cost savings—because they know that same software will automatically scale them up for performance?
Let’s take a look at how IBM Turbonomic does exactly that.
Cloud optimization actions—purpose-built to be automated
Turbonomic proactively identifies performance and cost risks—and provides the specific actions (purpose-built to be automated) that will prevent those risks. CloudWatch provides the tools for users to react, but when combined with Turbonomic, resourcing actions can be executed and/or automated to avoid performance degradation and cost overruns.
As seen below, IBM Turbonomic has identified 136 scale actions that will either avoid/address performance issues or save money. Note that some of these scale actions are for Azure nodes supporting AKS, while others are EC2 scaling actions (Turbonomic supports AWS, Azure, and GCP).
Below you can see these actions sorted by cost—some actions require investment (increasing resources for performance), while others will result in savings (reducing resources for efficiency). There are even actions to address compliance issues. You get this in a single view—and not just for your cloud VMs, but as you can see on the left, the types of actions are numerous and applicable to all the entities you have in your cloud estate. Each action listed is categorized by its type, whether that be a delete action, a scaling action (up or down), a buying action, a resizing action, a provisioning action, a move action, or an optimization action.
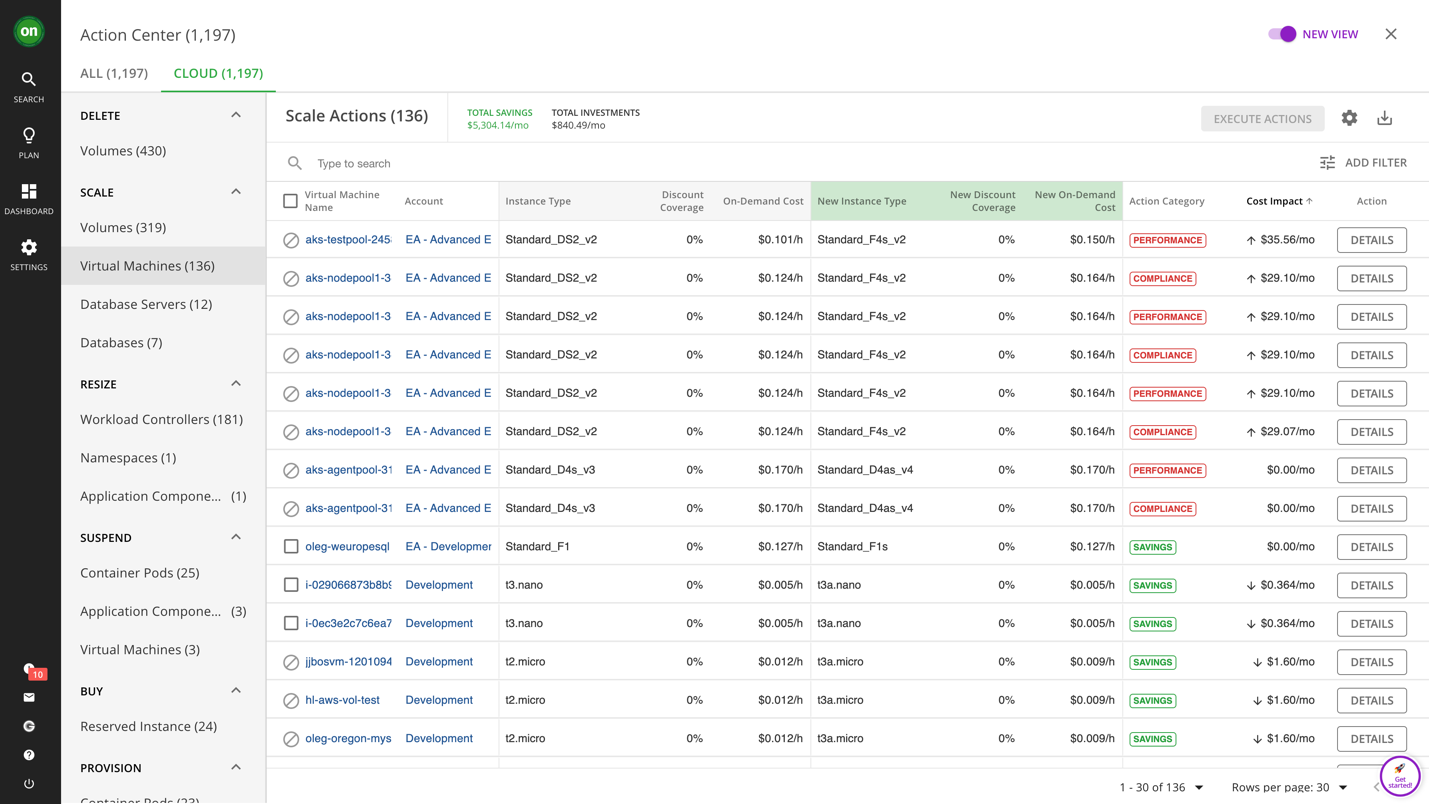
Automate micro improvements for macro results
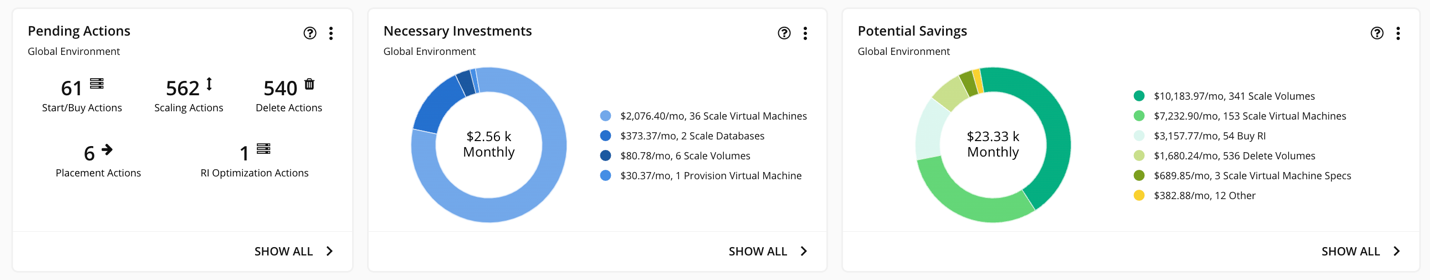
Turbonomic shows what the cost impact will be for you to take each individual action and how much you’ll save (or need to invest) per action. But, consider that there are 1197 actions in this demo environment—each providing micro-improvements for performance, cost, or compliance. The beauty of having software generate these actions is that it can operate at this scale—executing and automating these actions allows you to reap the benefits of thousands upon thousands of micro-improvements, depending on the size of your environment. In this example, Turbonomic shows that you can save over $23,000 per month by taking all 1100+ actions.
From full-stack visibility to full-stack automation
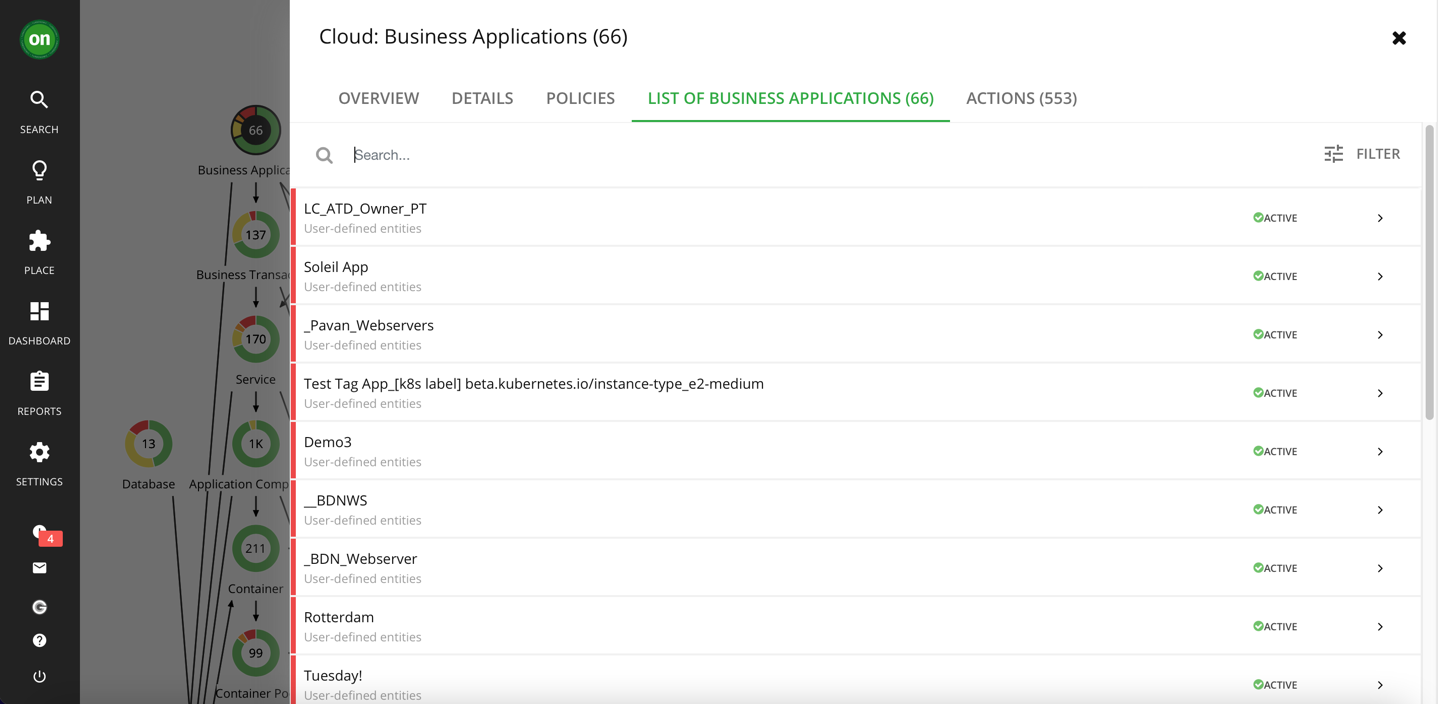
Why are the actions that Turbonomic provides safe to automate? It’s because the analytics accounts for resource dependencies across the application stack. A side benefit is that you get a complete visualization of all your applications—60+ business applications in this example below—and exactly how they consume resources from the underlying infrastructure (see supply chain visual on the left of the screenshot below).
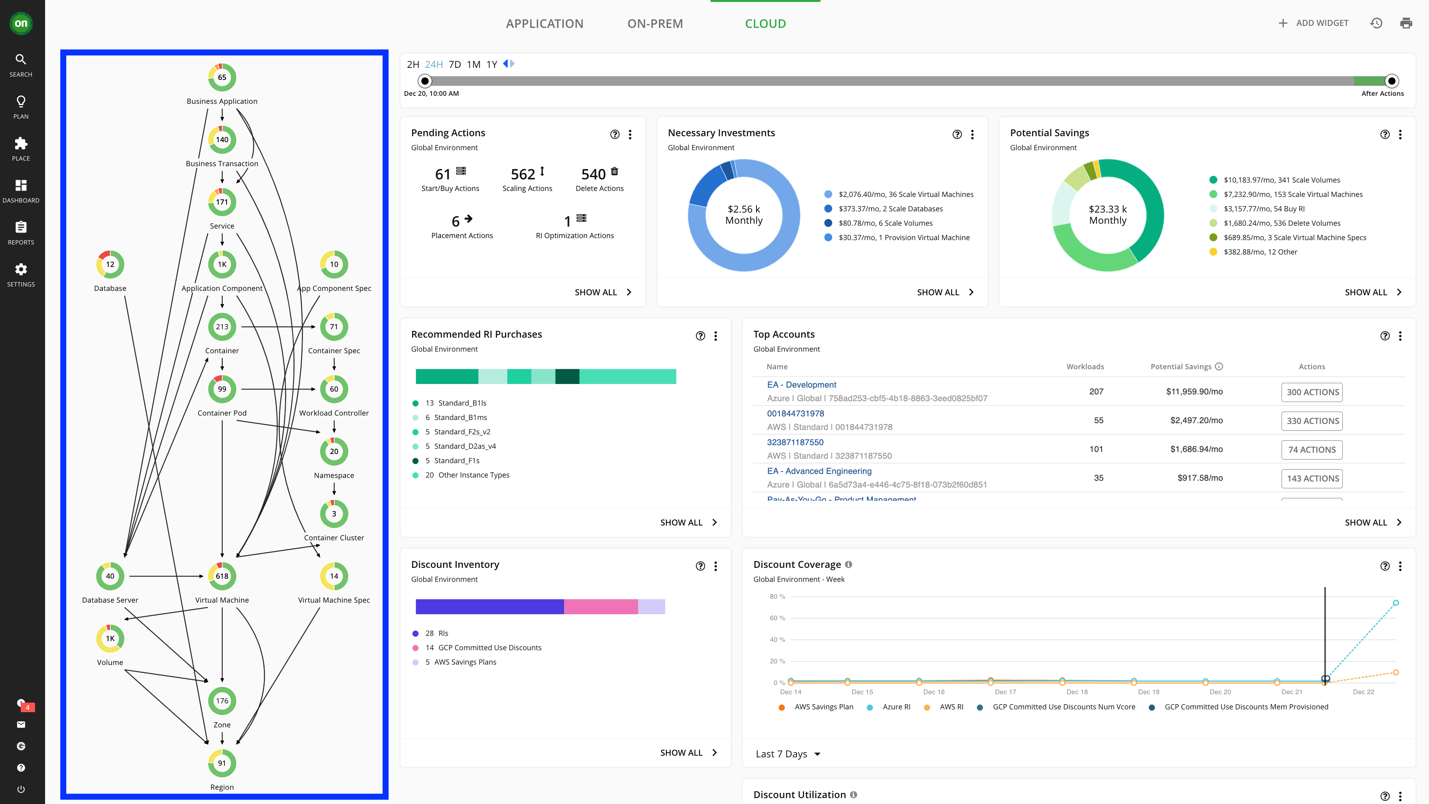
You can easily scope to the top applications or top accounts that matter to you. By selecting the Business Application entity in the supply chain, you then see this window that gives you an overview of your top business applications, how they are performing, and how many pending actions you have to take.
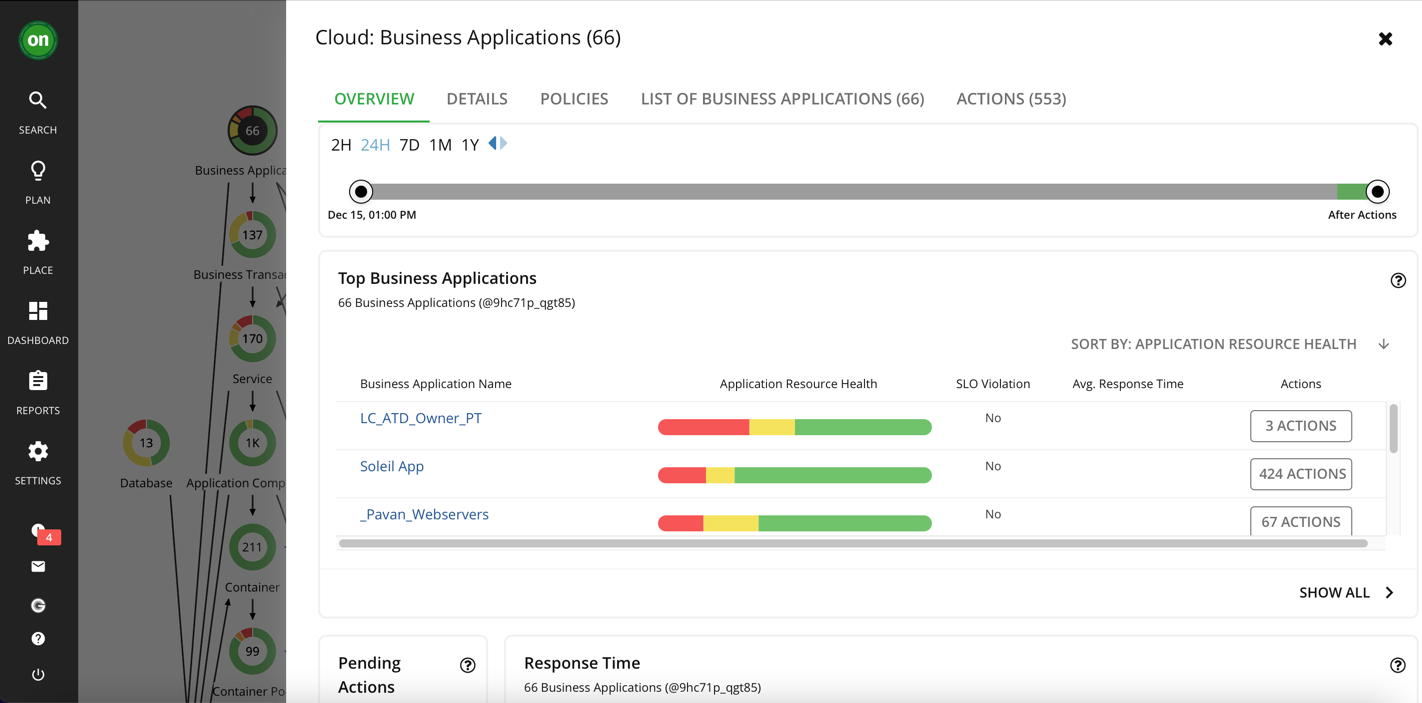
But if you are interested in knowing more about a single application, you can peruse the list of business applications until you find (or search for) the one you are looking for.
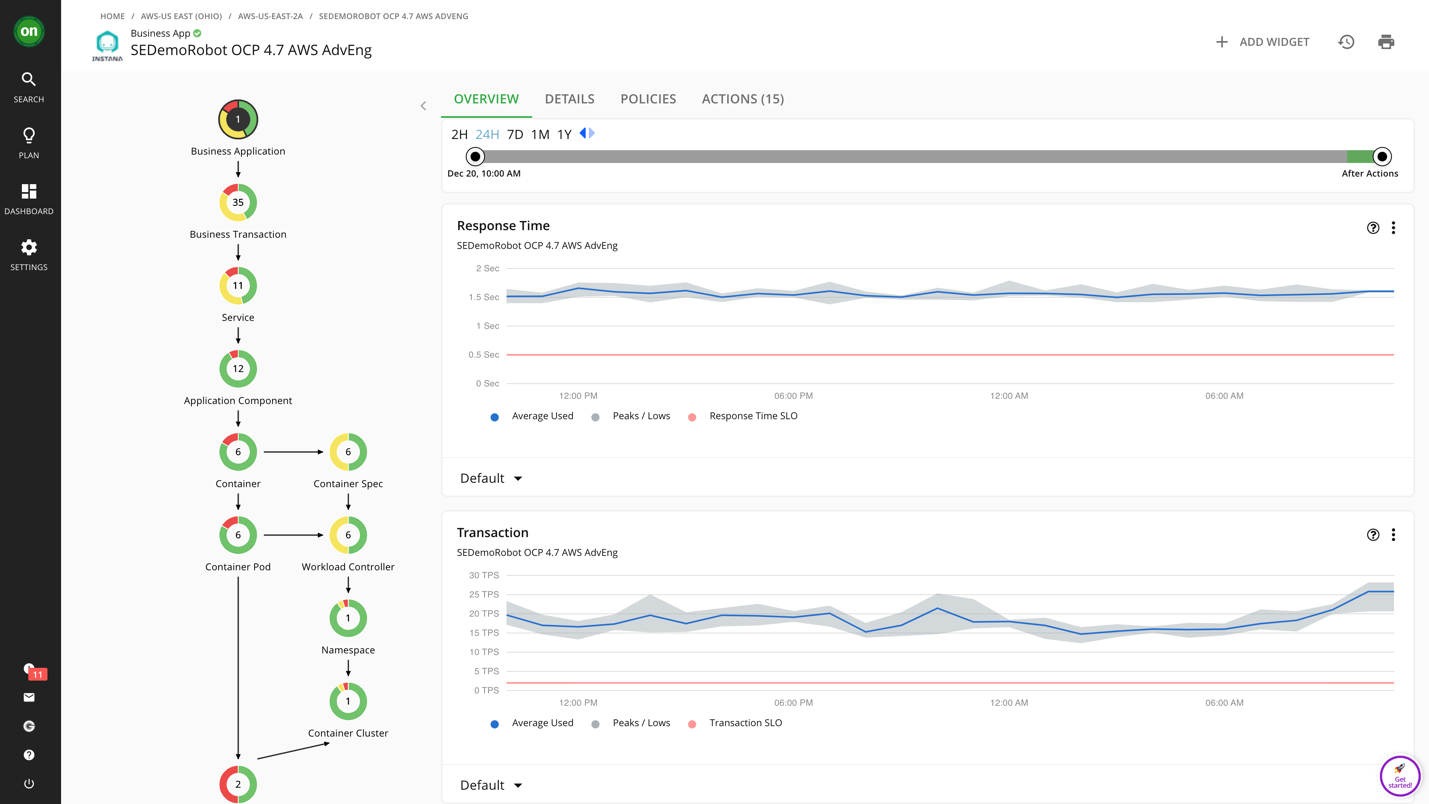
Let’s look at the application SEDemoRobot OCP 4.7 AWS AdvEng, for example (below). This is a microservice application being observed by Instana and running on OpenShift on AWS. In the view below, Turbonomic is pulling response time and transaction throughput metrics from Instana.
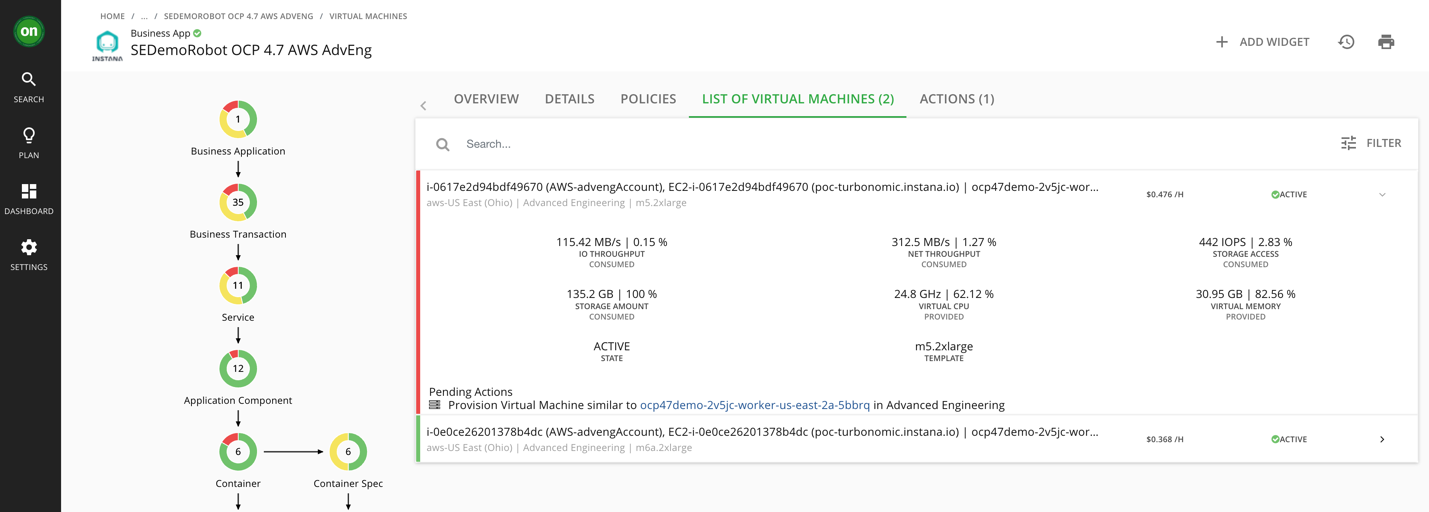
Because Turbonomic stitches the complete application stack—from app to platform to infrastructure—it also captures that this application is running across two AWS nodes. In fact, there’s an action here to provision another node (EC2 instance) aka scale out the OpenShift cluster to improve performance. It is this kind of application context—and the knowledge that the platform will scale up for performance, in addition to scaling down for cost—that gives AppDev teams the data they need to trust the automation so you—the Cloud Operator—can turn it on and reap the rewards.
Measuring EC2 performance is necessary, but not sufficient—automation in context is key
The ultimate goal that cloud users should strive for is an exceptional customer experience and elasticity. While measuring the performance of your EC2 instances is a critical piece, it doesn’t solve for continuous application performance at the lowest cost. To assure performance and decrease costs, you need automation that you can safely automate, data to give AppDev the confidence to trust in the automation, and a way to integrate resourcing decisions into your own systems and processes so that everything is done automatically. The aim is to decrease human intervention and monitoring and bring about a “zero touch” preventative process. This is how you get the best business value out of the cloud.
IBM Turbonomic is that solution. Check out our live sandbox to explore the product on your own, or request a demo to initiate a proof-of-value engagement and get Turbonomic quickly spun up for your environment—imagine seeing everything you’ve seen here with your own data, applications, and systems.
#Turbonomic#Cloud#Amazon EKS