Instana and IBM i Monitoring & Observability
Software is evolving in a rapid manner and organizations are moving away from monolithic applications towards more complex distributed systems. With this evolution, Application Performance Monitoring (APM) and system observability have become essential and crucial tools.
What is the difference between APM and Observablity?
- APM (Application Performance Management) refers to monitoring the performance and availability of an application.
- Observability is a measure of how well internal states of a system can be inferred from knowledge of its external outputs.
Monitoring and observability are not the same, but they are not different either as the line between both of them is very thin. On a high level, we can say that monitoring is a subset of observability, where observability helps you to find out the root cause of a broken process/flow. Monitoring does this by analysing the logs, traces etc.
Instana is a product which helps you achieve both monitoring and observability.
What is IBM I?
IBM i is an operating system (OS) which runs on IBM Power System and is suitable for mid-sized to enterprise business usages. Today, more than 15,000 applications run on this platform.
The iSeries architecture is different from most others in the computing industry in that it is flexible and is entirely focused on business computing and is largely self-managed.
Some of the notable features which distinguish IBM i from other systems are,
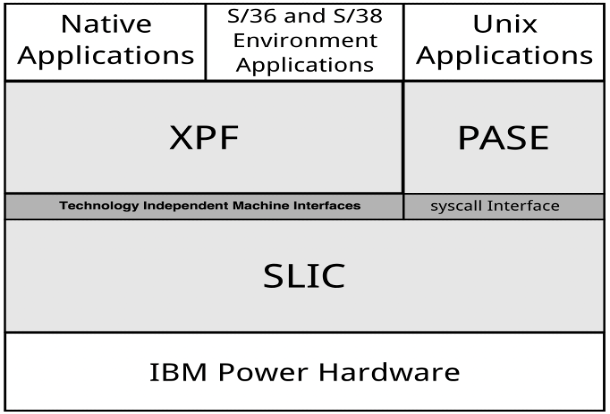
- Two-part primary operating system: There are two components to the operating system software on an iSeries server. The two components are System Licensed Internal Code(SLIC) and Operating System/400 (OS/400).
SLIC provides the TIMI (Technology-Independent Machine Interface), process control, resource management, integrated SQL database, security enforcement, network communications, file systems, storage management and JVM. SLIC is a hardened, high-performance layer of software at the lowest level, much like a Unix kernel, only far more functional.
- Technology-Independent Machine Interface (TIMI): OS/400 provides higher-level functions based on these services to users and to applications. OS/400 also provides a vast range of high-level languages (such as C/C++, COBOL, RPG, FORTRAN) runtime functions. Any hardware changes will have no impact on these applications.
- Object-based system: OS/400 keeps all information as objects. This is different from the simple byte-string, file-based manipulation used by many systems. Object-based design enables a powerful, yet manageable level of system integrity, reliability, and authorization constraints. All programs and operating system information, such as user profiles, database files, programs and printer queues have their associated object types stored here.
- Single-level storage: OS/400 applications and the objects with which they interact all reside in a very large virtualized, single-level storage. This includes the entire system, including the objects most other systems distinguish as `on disk’ or `in memory’ are all in the single-level storage. Objects are designated as either permanent or temporary. The benefit of providing a single, very large address space, in which all objects on the system reside, is that applications need not tailor their memory usages such as disk cache vs paging space to a specific machine configuration. This greatly facilitates the on-demand allocation of memory among logical partitions.
- Industry-leading security: The unique object-oriented architecture ensures that each object on the IBM i system can only act in its defined way. For example, it is impossible to transform (manipulate) a file type object (*FILE) into a program type object (*PGM). This makes the operating system virtually virus-resistant. Other kinds of objects include directories and simple stream data files, such as video and audio files. These stream-file objects provides a familiar open, read, and write operations.
- Multi-workload virtualization: IBM i is designed to allow the running of the same software for multiple clients at the same time on the same machine. Using the built-in work management subsystem capabilities in conjunction with the inherent security capabilities of Db2 for IBM i, it can provide isolation of workload. No client needs to ever interact with the data of the others.
This is the high-level architecture diagram of the IBM i system:
Instana offering for IBM i monitoring
Instana offers remote monitoring support for IBM-i OS, which means that you don’t have to make any changes in the system. By providing a few details of the system and minimum access for a user, we can collect, analyse and visualise it in Instana. To get the metrics from IBM-i OS, you can go for an on premises Instana installation or leverage the cloud-based deployment. For more information about setup and managing Instana, refer to Setup and Manage.
Note: Supported IBM i platform versions are: 7.2 , 7.3 and 7.4.

Instana server configuration
Instana agents are capable of working on both standalone virtual machines or cluster environments like Kubernetes or OpenShift cluster.
The following configurations are used to deploy and configure Instana agents in a Standalone virtual machine:
-
- To download agent package, refer to Packages Installation.
- As per debian/rpm package, run the following command to install the agent:
-
-
- Debian derivatives : sudo apt install ./<package_name>
- Redhat derivatives : rpm -i <package_name>
Example : rpm -i instana-agent-static-j9–20211020–1148.ppc64le.rpm
Note: Instana license is mandatory. For free trial, register here.
There are multiple ways you can deploy and configure in the cluster, provided it has network access.
Notes:
- For clusters running in an air-gapped environment, images need to be downloaded manually and pushed to your local registry. Image path should be updated as per deployment (Helm/YAML).
- In a cluster level (air-gapped) environment, if the container starts using Helm or YAML, then the agents and leader-elector images can be fetched from Docker hub and pushed to your local registry. But, if the deployment is done by using anoperator, you need to pull the agents and operator and push the same into your local registry.
Agent Configuration
For IBM i, Instana agent supports only remote-based monitoring, which means you don’t have to install the agent in your system. The remote monitoring can be achieved with very simple configuration in the agent side. One snippet of it is given here:
For more information, see configuration.
Note: ‘User_specification’ is the part where you can mention the custom configurations. Details for a few metrices follow below.
Metrices captured by Instana:
Some of the key metrics which Instana is capturing (as of Dec 2021) are:
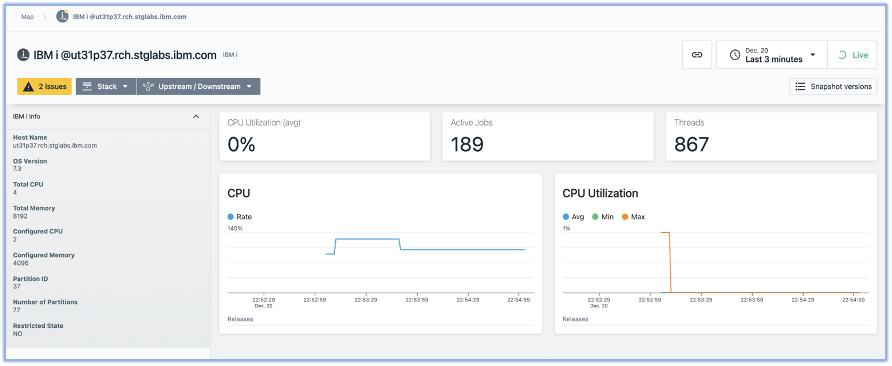
1. System Metrics:
The system metrics and KPIs which shows the overall status of the system are,
-
- CPU rate and utilization
- Active jobs
- Threads
- Auxiliary storage pool consumption
- Temporary storage
- Total spool space
For more detailed information, see System Metrics.
2. Top active jobs
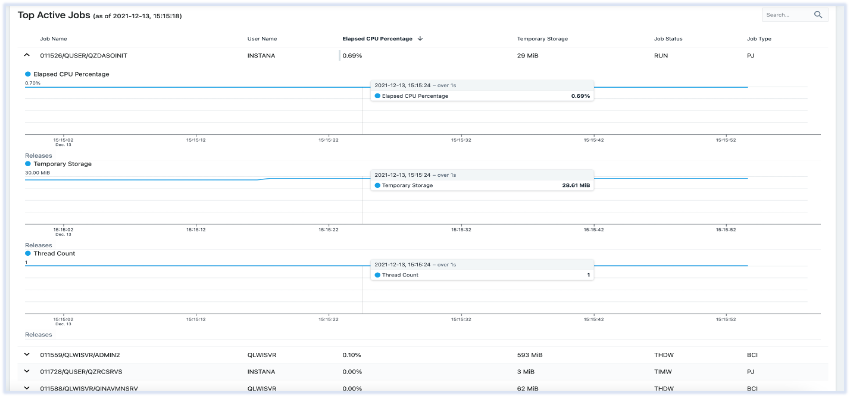
Instana captures the top 20 active jobs currently running in the system along with custom defined jobs. Custom Jobs can be mentioned in the ‘jobs’ section under ‘user_specification.’
For more details, see Top Active Jobs Metrics.
3. Auxiliary storage pool
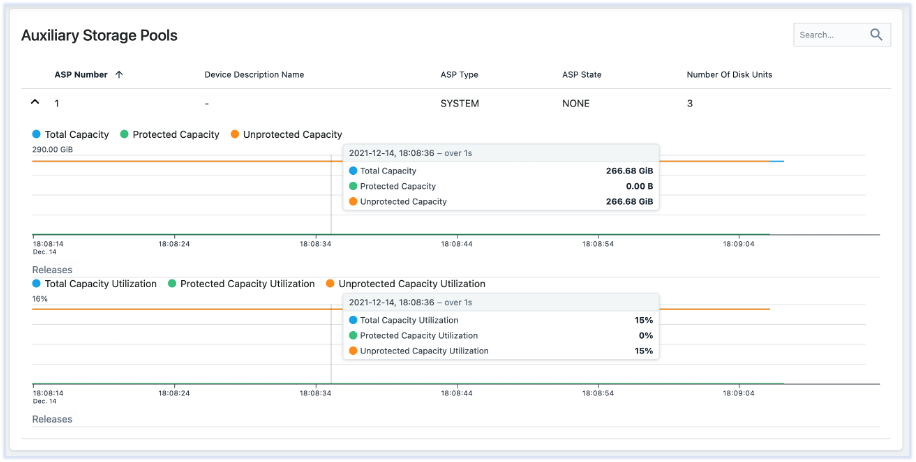
An auxiliary storage pool (ASP) is one or more physical disk units assigned to the same storage area. ASPs allow you to isolate certain types of objects on specified physical disk units.
For more details, see Auxiliary Storage Pool metrics.
4. Top spool space consumption
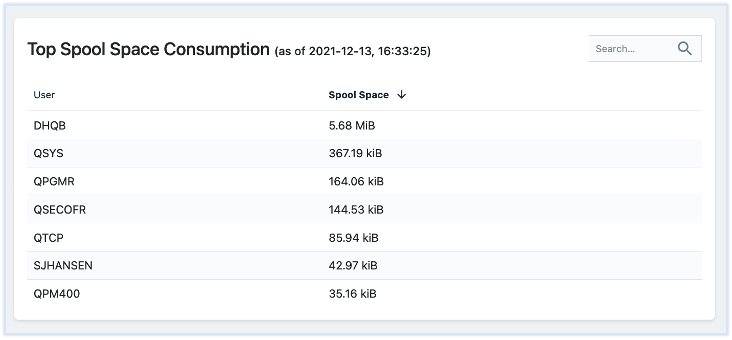
It describes each spooled files’ details in every output queue.
For more details, see spool space metrics.
5. Sub Systems Infos
It shows the details about all the sub system.
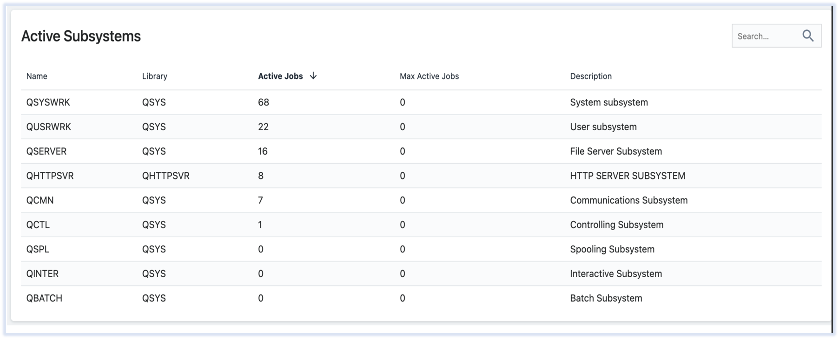
For more details, see Sub System Infos metrics.
Note: This metrics will be available for the OS version – 7.3 onwards.
6. Job Queue
It provides the details of the job which are yet to process and are waiting in the queue.
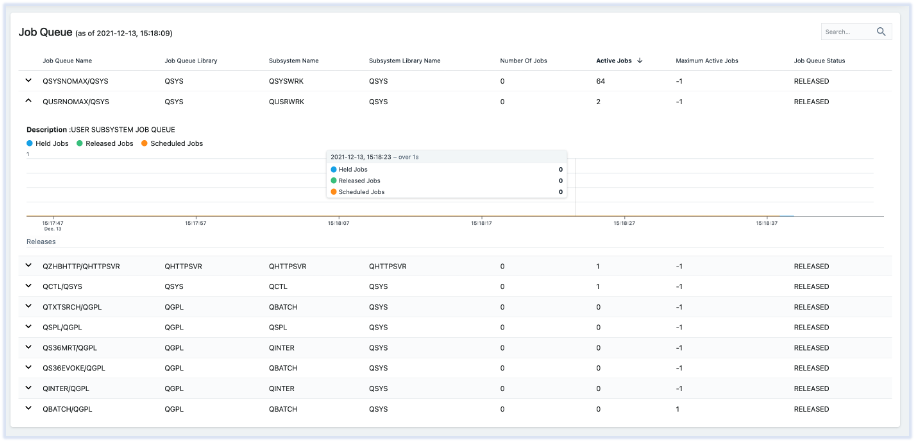
For more details, see Job Queue metrics.
7. Env Info
It provides the basic details about the IBM i OS’s basic configurations and their versions.
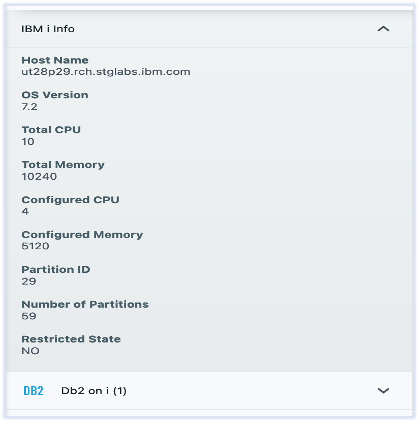
8. Memory pool
It will have one row for every active pool and the information returned is similar to the detail seen from the Work System Status (WRKSYSSTS) command.
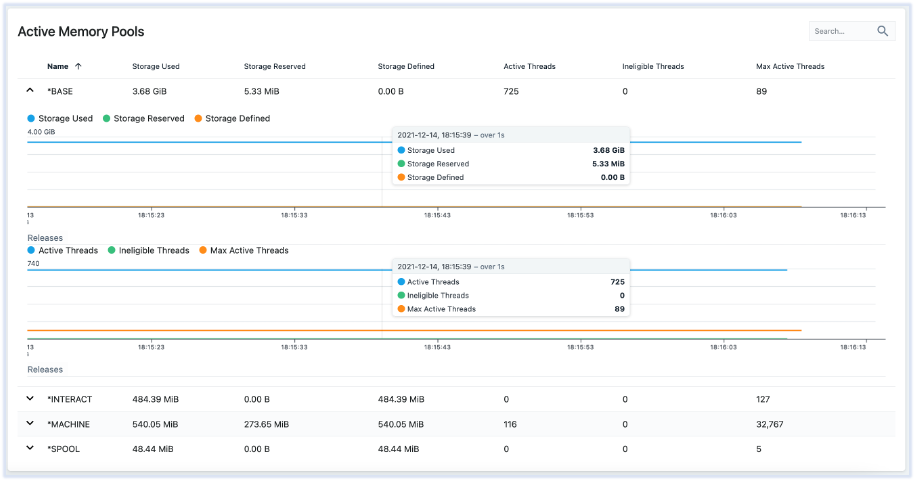
For more details, see Memory Pool metrics.
9. Netstat info (Top Receiver)
This provides the information about IPv4 and IPv6 network connections based on the bytes received.

For more details, see the Netstat info.
10. Netstat info (Top Sender)
It provides the information about IPv4 and IPv6 network connections based on the bytes received.

For more details, see Netstat info.
11. Netstat interface
It provides the information about IPv4 and IPv6 interfaces.

For more details, see Netstat Interface.
12. Message queues
It provides details about the messages which are currently in the queue.
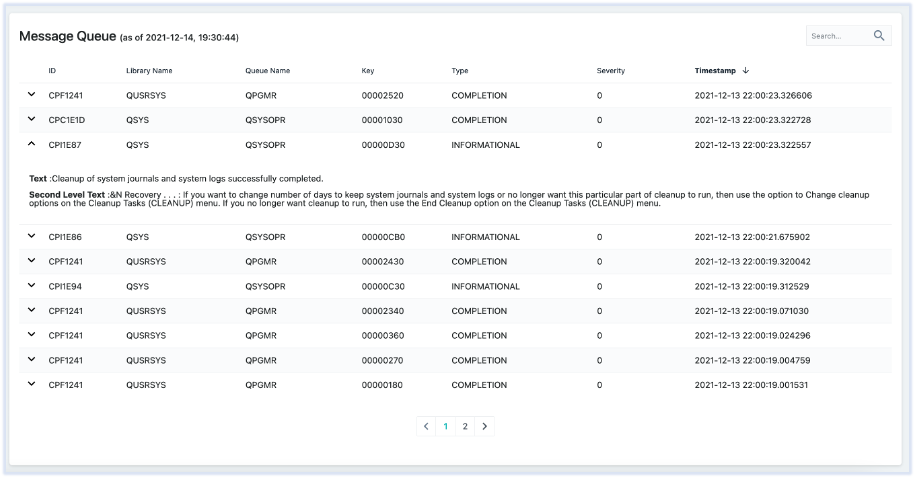
For more details, see Message Queue.
Events and Alerting feature of Instana
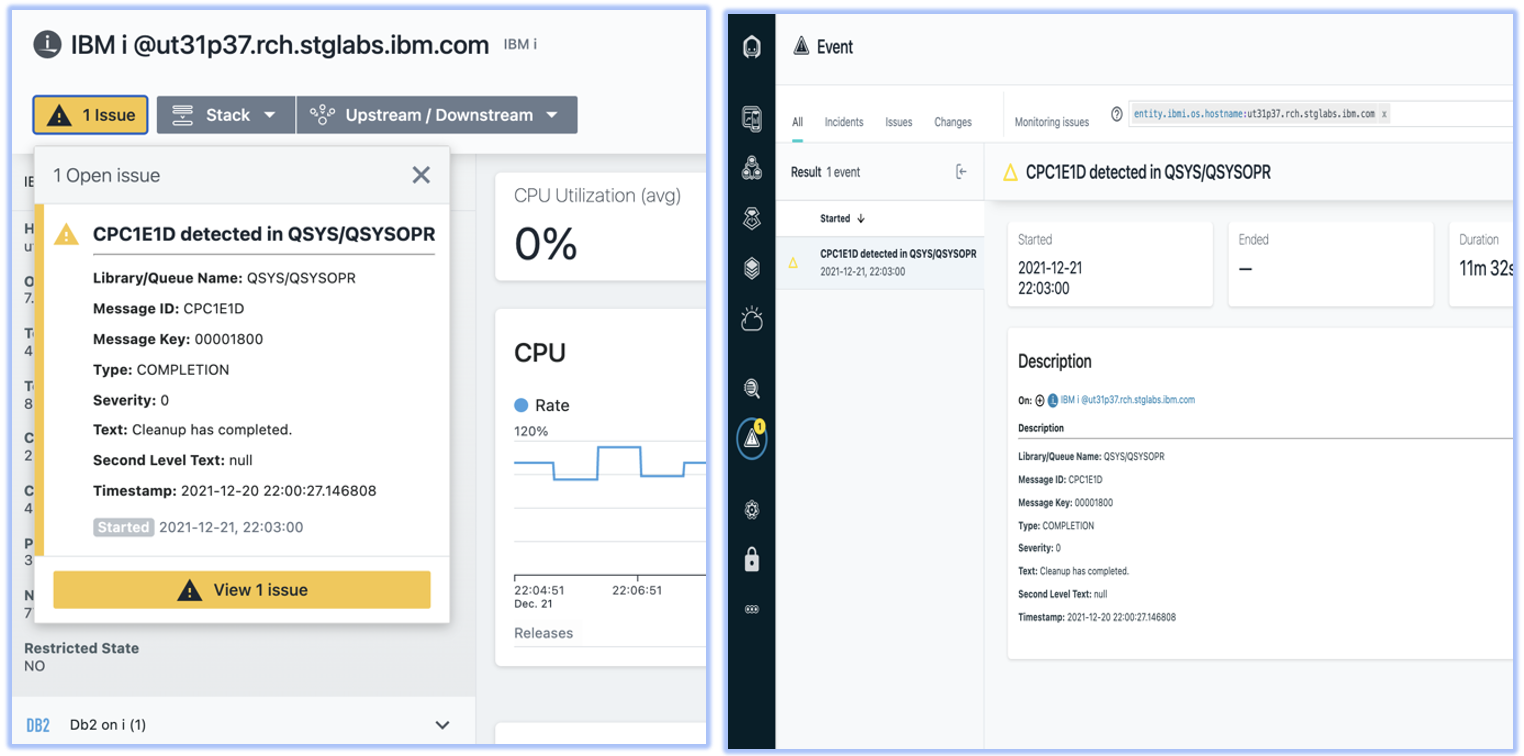
Instana has the capability to generate an alert whenever user defined message ID, queue library and queue name combination matches for any of the incoming messages in the message queue within the specified time (like last 10 minutes). These alerts will enable you to take any necessary action sooner.
The configuration will be the same as under the ‘event’ section.
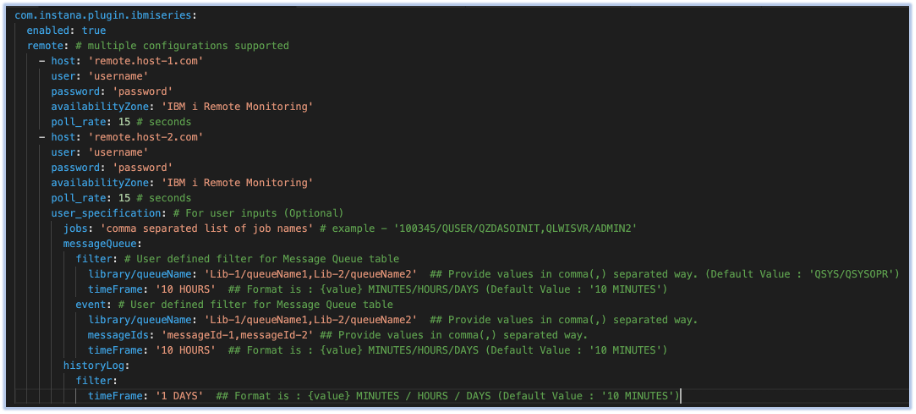
While the incoming message will match with the user defined values, it will generate events such as the one shown here.
I hope this will help you to get a basic understanding of Instana for IBM i.
If you would like to find out more about Instana and its monitoring capabilities, please refer to Microservices.
#IBMi