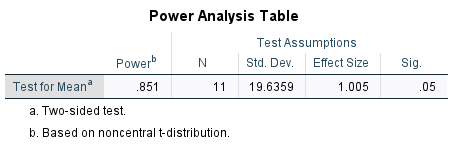
My power analysis for the one sample t test was done for estimating the power (because I aimed for a sample size > 30 for two groups, one of my groups only managed to get < 30 however). My data consists of a survey that was administered and was converted to a score/100 and then compared to an established mean value. For the purposes of my data, I did a one sample t test twice (two samples and wanted to compare the respective samples to an established mean value) and found that the means of both groups were statistically different from the established mean. I did a power analysis to estimate the power which I gave the calculated mean of the sample size, the sample sizes' respective standard deviation, the sample size, a null value which I understood was supposed to be the value I am comparing it to (i.e. the established mean), and then done again for the second sample group. (these one sample t tests were done in separate data sets in order to get the results for the two sample sizes before doing the power analysis)
My first output was:

My second was:
I also did one for independent samples t test to compare if the means were significantly different from each other and the independent samples t test for that said they were not different from each other. This is the power analysis for independent samples t test:
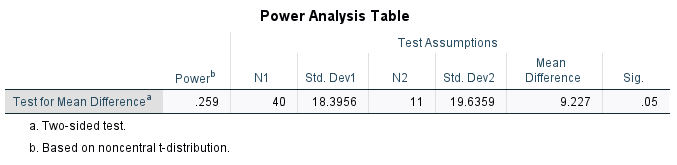
how do I interpret the power analysis results?
------------------------------
Emanuel Mejia
------------------------------
#SPSSStatistics