Here's an example to clarify.
data list free /dv x1 x2 group.
begin data.
12 8 1 1
13 9 3 1
10 7 4 1
11 8 3 1
12 6 4 1
22 8 5 2
24 9 6 2
21 7 6 2
28 5 5 2
24 4 7 2
09 5 8 3
10 6 8 3
10 7 9 3
12 8 9 3
08 5 8 3
end data.
MEANS TABLES=dv x1 x2 by group
/CELLS=MEAN COUNT STDDEV
/STATISTICS ANOVA LINEARITY.
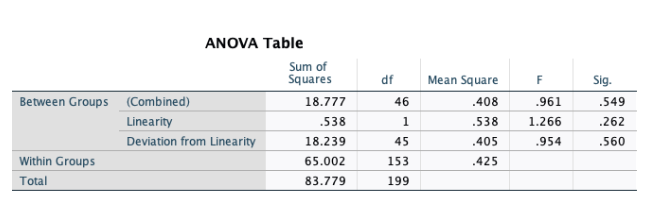
When you look at the results, you see:
1. dv has a significant deviation from linearity test.
2. x1 has neither a significant linear relationship or non-linear one to group membership.
3. x2 has a linear relationship; as group membership changes, x2 increases on average.
So, the "linearity" test looks at the strength of the linear relationship, the "deviation from linearity" test the non-linear one.
------------------------------
Rick Marcantonio
Quality Assurance
IBM
------------------------------
Original Message:
Sent: Tue July 19, 2022 03:51 AM
From: Simone David
Subject: Assessing Linearity - What is the difference between the "Deviation from Linearity" Statistic and the "Linearity" Statistic
I'm trying to assess the linearity of a variable on the DV. However, the scatterplots are hard to decipher due to a weak relationship. As I couldn't tell whether it was linear from the scatterplot, I found a linearity test on SPSS.
This test is accessible through SPSS (Compare Means> Means> Options [Select "Test for Linearity"]> Run).
I'm just a bit confused on the difference between "Linearity" and the "Deviation from linearity" in this test.
If I'm looking to pass the linearity assumption, do I need a non-significant deviation from linearity? Or do I need a significant Linearity?
------------------------------
Simone David
------------------------------
#SPSSStatistics