IBM SPSS Modeler already includes map capabilities but far away of being perfect. Now we can create beautiful maps in a matter of seconds and all in the same SPSS Modeler workbench thanks to the integration of SPSS Modeler with R Programming Language. The extensions are available in the
SPSS Modeler Marketplace that we launched last week and they are free.
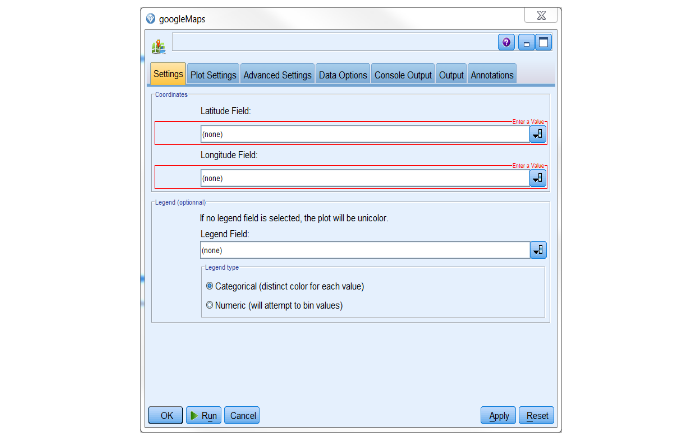
In the maps you can use the same color for all points or use a legend column to specify a color code. This legend may be categorical or continuous. Several color palettes are available (sequential, divergent, qualitative or monochrome) covering all possible use of the node.
More precisely, this node generates an HTML file which can be saved to a specific directory and/or opened in the default browser on execution. This html page is an interactive map, that is to say you can move, zoom in and out, etc. The R package used is called
PlotGoogleMaps.
Download extension:
Plot Spatial Data
This is an example of interactive map generated directly with the node:
Enter full screen map here: http://armandruiz.com/SPSSmaps/crimeChicago1.html
Check the video tutorial to learn how to use the node in our channel IBM SPSS Predictive Extensions:
[youtube https://www.youtube.com/watch?v=M__XUbiWf30]
You can get full documentation here:
PDF with documentation of the node #Cloud#geospatial#Programmability#rstats#SPSS#SPSSModeler#SPSSStatistics