The SPSS Statistics Custom tables (CTABLES) procedure can test equality of column proportions and column means. The test results are displayed either in a separate table or, using APA style, in the main table. Users commonly want to highlight significant differences, which is not possible using built-in functionality. This article explains how to do this.
Setup: In order to use the approach described here, you need the Python Essentials, including the SPSSINC MERGE TABLES and SPSSINC MODIFY TABLES extension commands. If these are not already installed, they can be obtained via the SPSS Community website. Details of what is installed by default vary across versions of Statistics. If your installation of SPSSINC MODIFY TABLES does not have the custom function described below, get a newer version from the website.
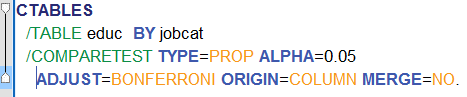
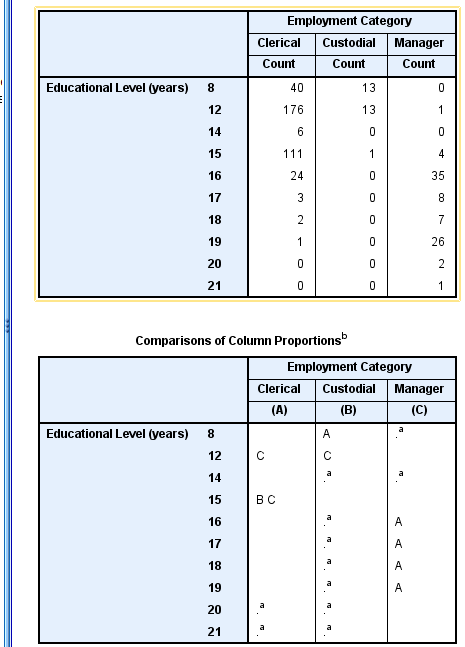
Here is the syntax and output from CTABLES testing equality of column proportions, The example uses the employee data.sav file shipped with Statistics. Our goal is to show the significant differences in the main table and highlight them..
You might first ask why we did not start with the single table output in APA style, since we want to show significance in the main table. There are two reasons: first, in my experience, nobody likes the APA style, and, second, it won't help us to color the significant cells anyway.
If you have Statistics version 22 or later, you might think that the new OUTPUT MODIFY command or Table Style subdialog could handle this task, but it can't, because the significance values do not occur in the test table with their own column. While OUTPUT MODIFY is a fabulous tool for unconditional or conditional formatting of tables and is very easy to use, this problem is too complicated for it.
We should, before proceeding further, pause to clarify what we mean by coloring significant cells. Significance is a property of pairs of cells, not of individual cells. In the test table above, the columns are lettered A to C, and the key of the the row with a significantly smaller column proportion is shown in the category of the larger proportion. Without the letter codes, you would know, for example, that educational level 15 is significantly larger for the Clerical category than for some other job categories, but you would not know which ones. So we can't just replace the letter codes with a color without a loss of information.
We can, however, color cells corresponding to the significance codes while retaining the specific information about which categories they refer to. There are two steps to the process. The first step is to merge the test table into the main table. In order to do that, we need to use the SPSSINC MERGE TABLES extension command. MERGE TABLES works by joining columns (or rows) of tables based on the column labels, possibly adjusting for extra terms appearing in only one. In this example, we will join the tables based on the job category labels - Clerical, Custodial, and Manager, ignoring the Count and letter codes that also appear. Fortunately the default settings in MERGE TABLES do this automatically.
Using the MERGE TABLES dialog box under Utilities > Merge Viewer Tables, the dialog would look like this.
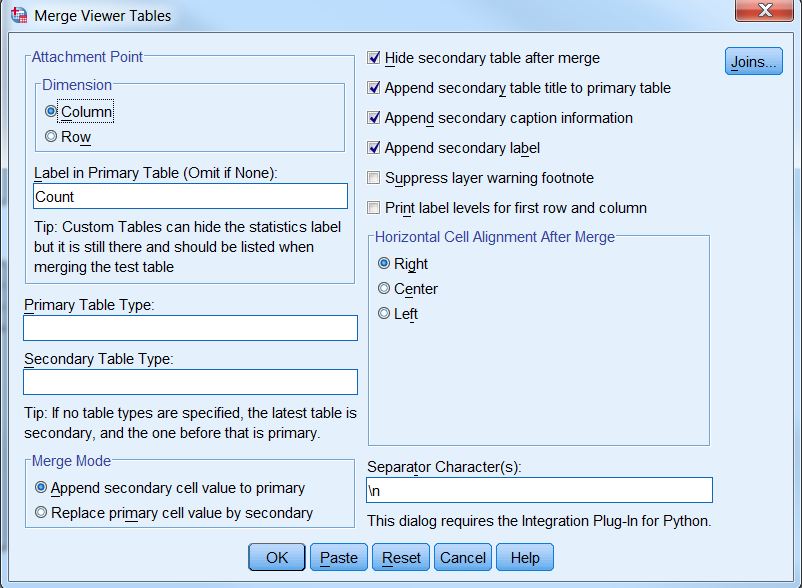
We didn't specify table types, so the command uses the most recent pair of tables in the Viewer. We are merging by column based on the Count statistic. In this case, that is the only statistic, but if the table also contained, say, percentages, specifying Count would single out the Count columns for the merge. MERGE TABLES has many other features for more complex merging. Check out the help if your tables are too complex for a simple merge.
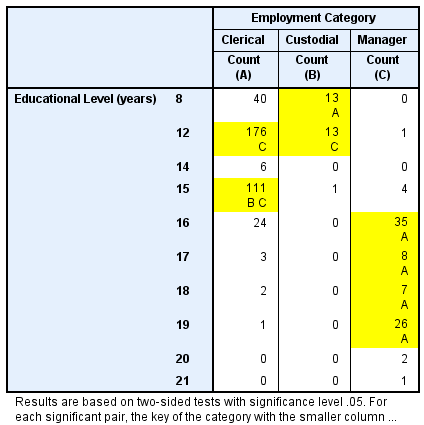
Here is the result of the merge.
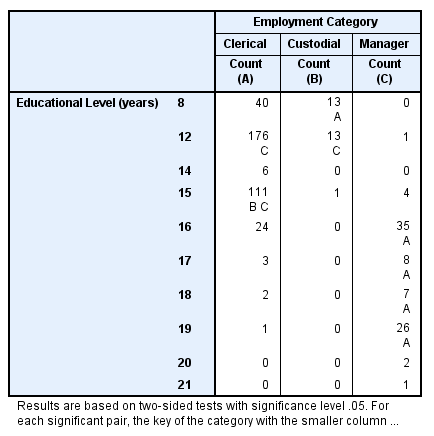
As you can see, the letter codes from the secondary tables now appear in the corresponding cells in the main table, and the caption from the secondary table has been attached to the main table. Now we want to go further and highlight the cells that have a letter code. This is where the SPSSINC MODIFY TABLES (Utilities > Modify Table Appearance) extension command comes in.
MODIFY TABLES can apply conditional or unconditional styling to table cells and labels. It has built-in syntax for selecting cells and bolding, foreground and background coloring, and other properties, but here we need to go a little further. We need to select the cells that contain a letter code and then apply styling. MODIFY TABLES allows for small plug-in functions to extend its capabilities, and, fortunately, there is a plug-in function included with the command to do exactly that. Here is what the MODIFY TABLES dialog looks like for this task.
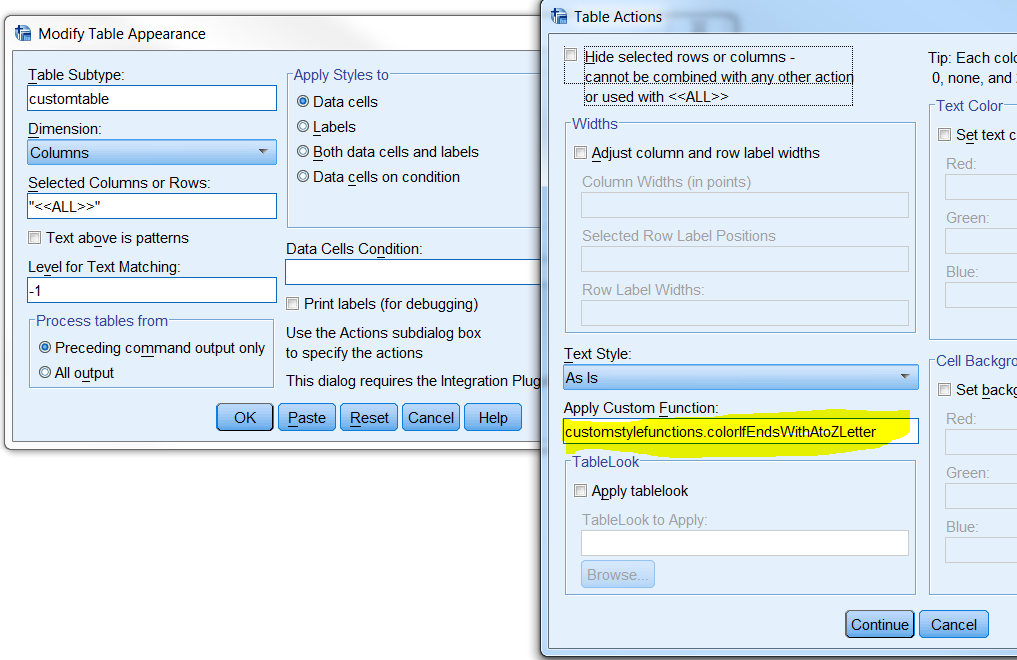
We specified that all cells should be selected - note the odd notation - and that the action is to apply the function shown in the subdialog. In this example we accept the default background color of yellow, but you can specify red, blue, and green color values between 0 and 255 as parameters to get different colors.
To see the full set of functions in the customstylefunctions.py module included with the command, open that file in a plain text editor. The comments describe how to use each function, so you don't need to know Python in order to use them. Note, though, that the function and parameter names are case sensitive.
You can write your own custom functions, which are usually very short, if you know a little bit of Python.
To use a different background color, say, red, the custom function text would be
customstylefunctions.colorIfEndsWithAtoZLetter(r=255, g=0, b=0)
Finally, here is the result. All the cells that have a letter in the value now have a yellow background. We could have done something similar with bolding the cell text or applying a different styling.
In summary, by applying the SPSSINC MERGE TABLES and SPSSINC MODIFY TABLES to the CTABLES output containing the test results in a separate table, we have highlighted the significant differences while preserving the details from the secondary table.
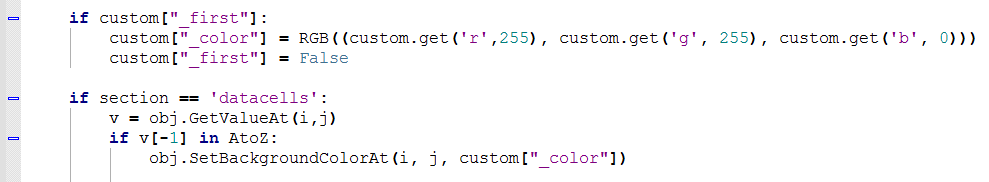
p.s. If you are wondering about writing your own custom functions, this is the entire code for the function described here other than the standard function signature. First it calculates the color based on the parameters specified. Then, as it is fed the table data cells, it checks the value for a letter code and sets the background color if one is found.
#extensions#SPSSStatistics#stylingtables