As I talked about previously, great circle lines are an effective way to visualize flow lines, as the bending of the arcs creates displacement among over-plotted lines. A frequent question that comes up though (see an example on GIS.stackexchange and on the flowing data forums) is that great circle lines don't provide enough bend over short distances. Of course for visualizing journey to crime data (one of the topics I am interested in), one has the problem that most known journey's are within one particular jurisdiction or otherwise short distances.
In the GIS question I linked to above I suggested to utilize half circles, although that seemed like over-kill. I have currently settled on drawing an arcing line utilizing quadratic Bezier curves. For a thorough demonstration of Bezier curves, how to calculate them, and to see one of the coolest interactive websites I have ever come across, check out A primer on Bezier curves - by Mike "Pomax" Kamermans. These are flexible enough to produce any desired amount of bend (and are simple enough for me to be able to program!) Also I think they are more aesthetically pleasing than irregular flows. I've seen some programs use hook like bends (see an example of this flow mapping software from the Spatial Data Mining and Visual Analytics Lab), but I'm not all that fond of that for either aesthetic reasons or for aiding the visualization.
I won't go into too great of details here on how to calculate them, (you can see the formulas for the quadratic equations from the Mike Kamermans site I referenced), but you basically, 1) define where the control point is located at (origin and destination are already defined), 2) interpolate an arbitrary number of points along the line. My SPSS macro is set to 100, but this can be made either bigger or smaller (or conditional on other factors as well).
Below is an example diagram I produced to demonstrate quadratic Bezier curves. For my application, I suggest placing a control point perpindicular to the mid point between the origin and destination. This creates a regular arc between the two locations, and conditional on the direction one can control the direction of the arc. In the SPSS function provided the user then provides a value of a ratio of the height of the control point to the distance between the origin and destination location (so points further away from each other will be given higher arcs). Below is a diagram using Latex and the Tikz library (which has a handy function to calulate Bezier curves).
Here is a simpler demonstration of the controlling the direction and adjusting the control point to produce either a flatter arc or an arc with more eccentricity.
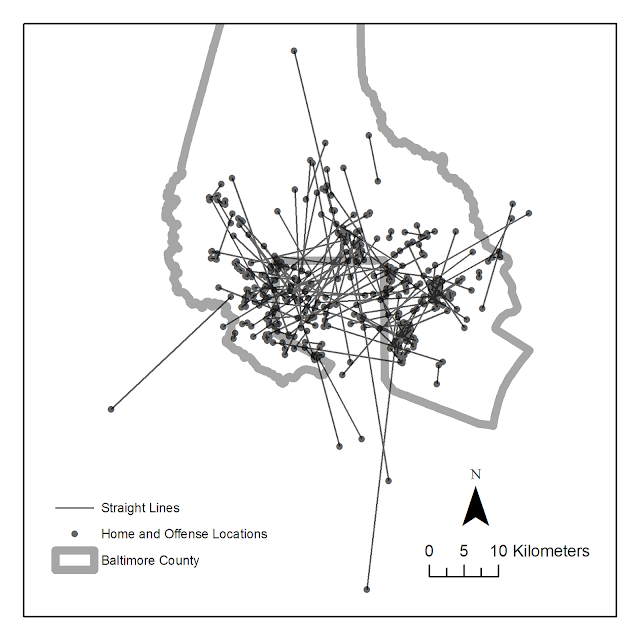
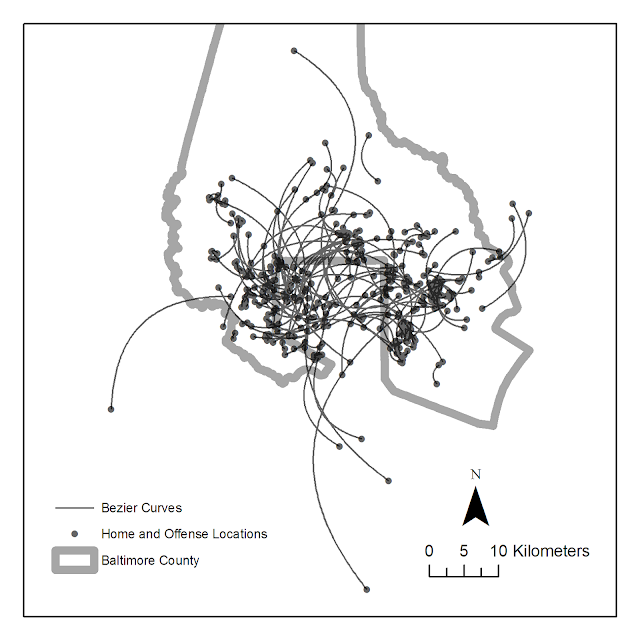
Here is an example displaying 200 JTC lines from the simulated data that comes with the CrimeStat program. The first image are the original straight lines, and the second image are the curved lines using a control point at a height half the distance between the origin and destination coordinate.


Of course, both are most definately still quite crowded, but what do people think? Are my curved lines suggestion benificial in this example?
Here I have provided the SPSS function (and some example data) used to calculate the lines (I then use the ET Geowizards add-on to turn the points into lines in ArcGIS). Perhaps in the future I will work on an R function to calculate Bezier curves (I'm sure they could be of some use), but hopefully for those interested this is simple enough to program your own function in whatever language of interest. I have the starting of a working paper on visualizing flow lines, and I plan on this being basically my only unique contribution (everything else is just a review of what other people have done!)
One could be more fancy as well, and make the curves different based on other factors. For instance make the control point closer to either the origin or destination is the flow amount is assymetrical, or make the control point further away (and subsequently make the arc larger) is the flow is more volumous. Ideas for the future I suppose.
#cartography#datavisualization#flow-data#mapping#SPSS#SPSSStatistics#Visualization