 The Pro’s Guide to Breaking Down Cost Drivers on a Report
Or
How to Pick and Choose your Reportable Costs from Anywhere in the Model via FilterUnits
What’s my use case?
Let’s say in your Cost model you have three groupings of labor: Internal FTE, Internal PTE, and External. As your dollars allocate upwards from your Labor object into Towers, your groupings mix. Now let’s say your Tower Owners ask you, “I need to know the mix of Internal FTE, Internal PTE, and External costs that comprise my Tower & Sub-Tower costs. Can you build a report that shows that?”
You may be able to tell them their breakdown by drilling down the model into labor…
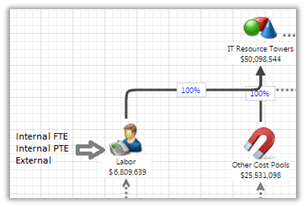
But how do you get all those numbers to line up and add together on a single report?
Enter the FilterUnits Factor
You can use the FilterUnits formula in a metric to pull in cost columns from lower objects (basically points in the model) and put them on a single report table by a single concept or grouping. In our scenario, we’ll be using Tower & Sub-Tower and the labor concepts Internal FTE, Internal PTE, External. These three concepts are based off of the column: Labor Master Data.Labor Type
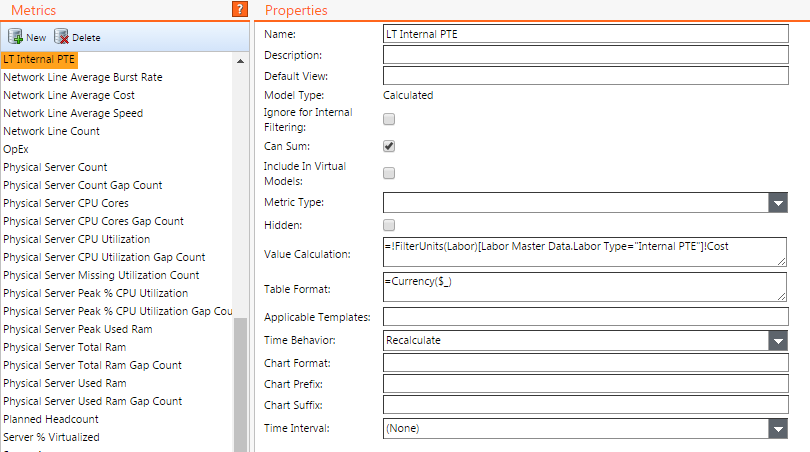
- Go to your Studio -> Metrics tab.
- Create three new Metrics, one each for the three labor types: Internal FTE, Internal PTE, External. Use the syntax: =!FilterUnits(Labor)[Labor Master Data.Labor Type="Internal PTE"]!Cost
- Make sure to check Can Sum on, and change Table Format to =Currency($)
4. Create a new report. On the report, create a new table based on the IT Resource Towers object.
5. Add IT Resource Tower Name and IT Resource Sub-Tower name to the Rows section of the Ad Hoc Query dialog.
6. From the Calculations perspective, find and add your three new metrics.
7. Add the Labor cost driver as well for comparison.
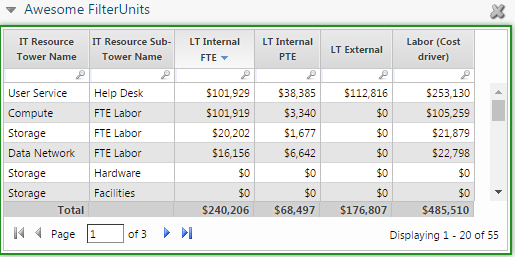
8. You’re done! You’ve just created a tower level table that shows your break down of spend by labor types:
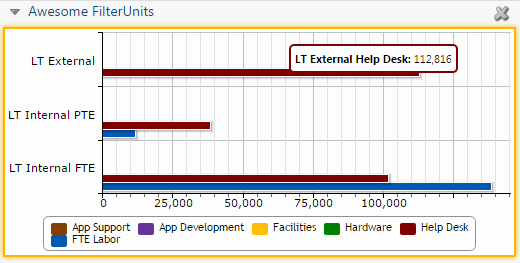
Now you can flip it into a fancy chart:
Or use it elsewhere in the model. FilterUnits can get very complex. Be aware, however, that increased complexity results in increased pre-calculation times. If you’re interested in more techniques like this one or utilizing a more advanced version of this, consider adding on a Premier Success service to accelerate your time to value!