This report is part of a series. See .
Actions
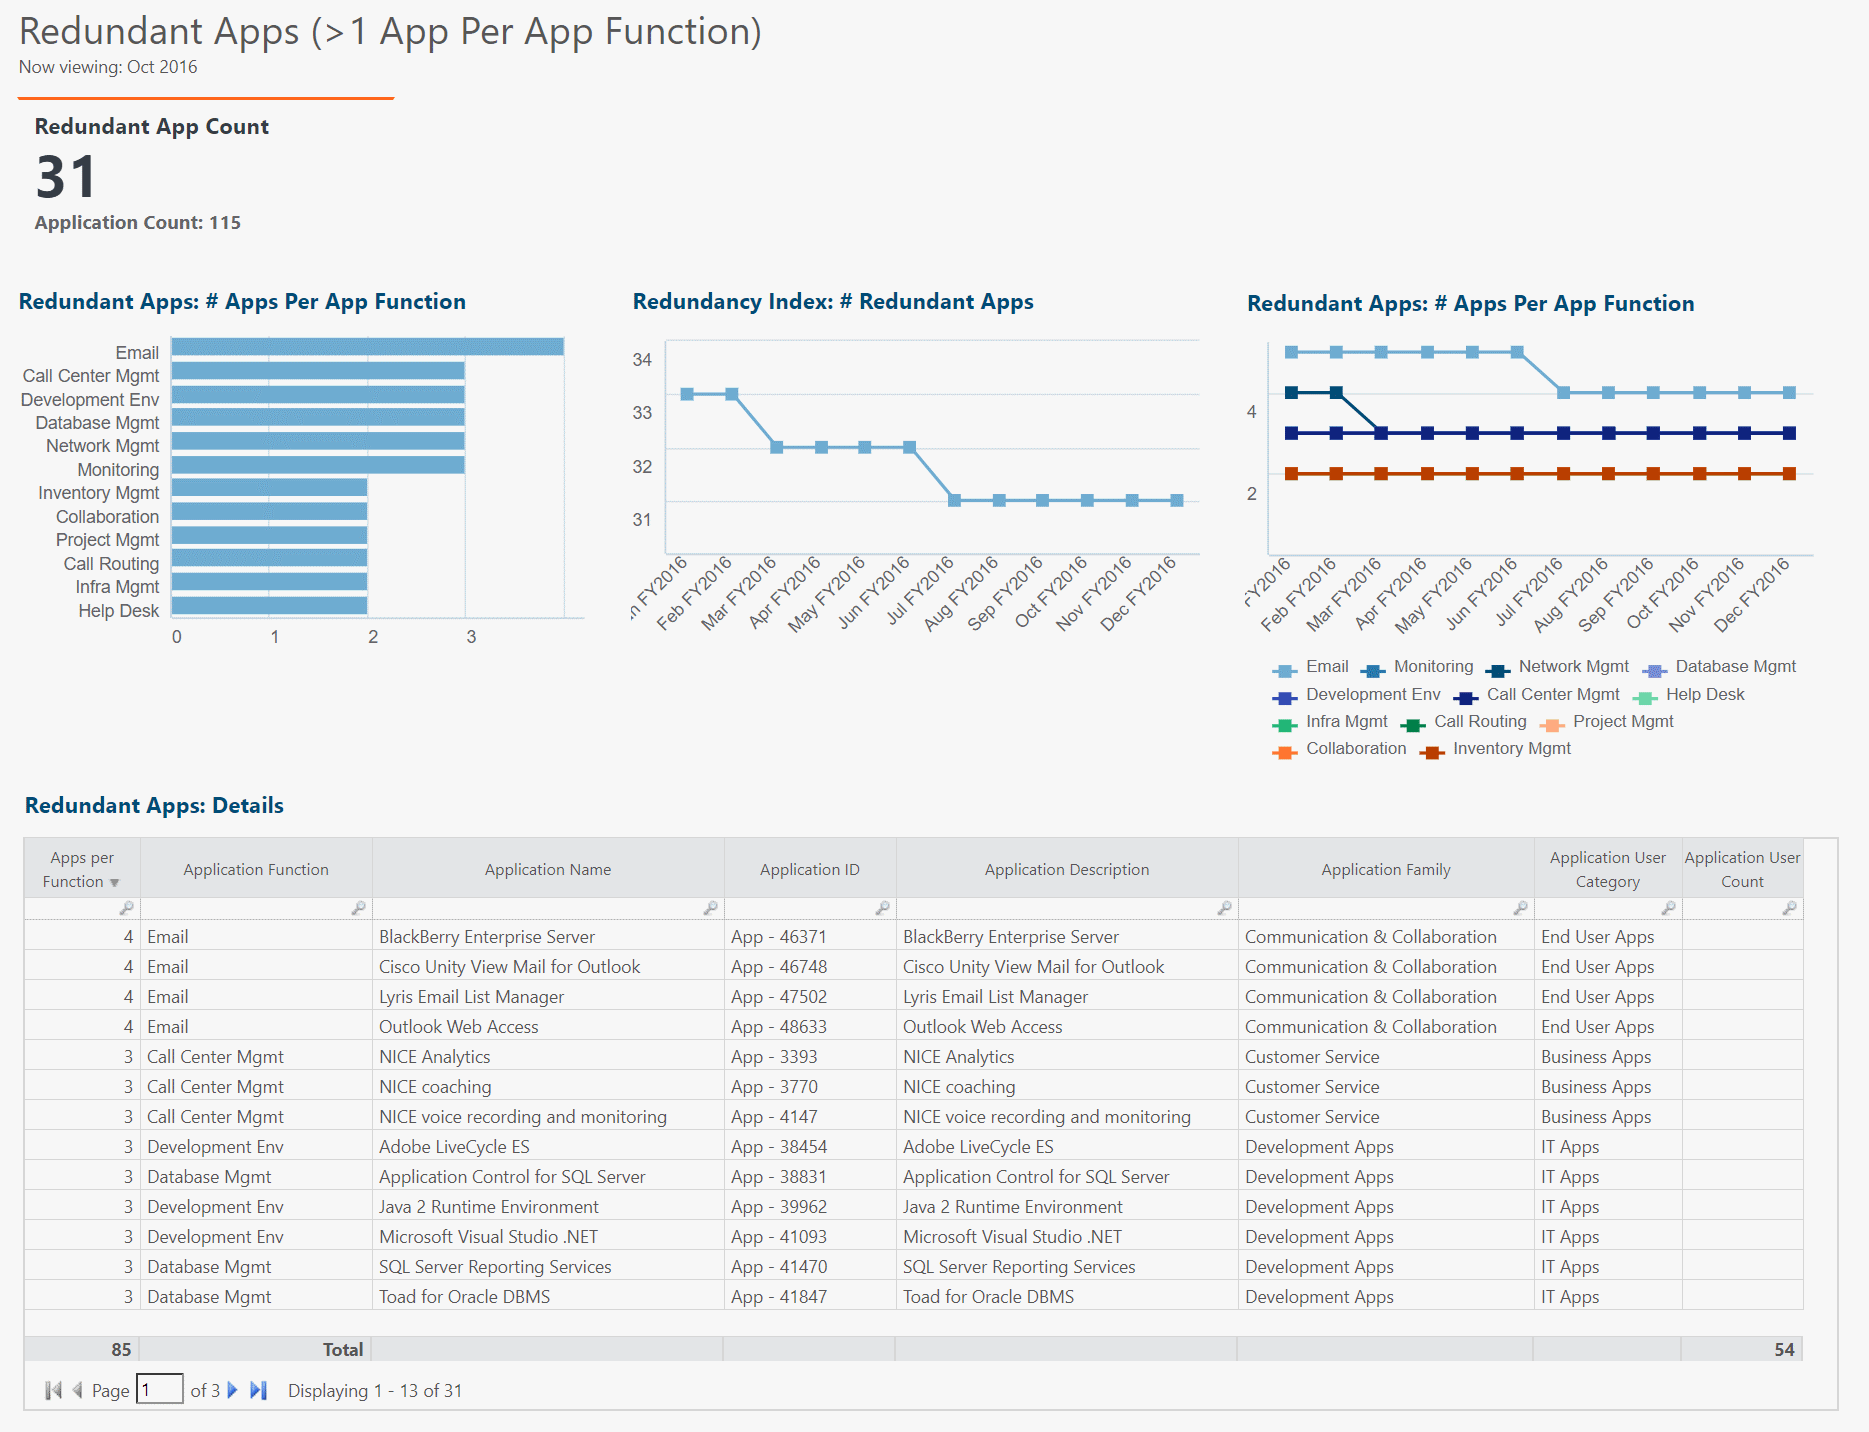
- Supply list of redundant apps to app (or app service) owners.
- Ask owners to verify the need for multiple apps per app function.
- Ask owners to determine which apps can be phased out.
- When cost model is complete, add cost to this report.
- If app satisfaction survey data available, add to this report—help determine which app(s) to retire.
Data
REQUIRED
Applications.Application Name
Applications.Application Count
Applications.Application Function
USEFUL
Applications.Application ID
Applications.Application Description
Applications.Application Family
Applications.Application User Category
Applications.Application User Count
Build the report
CALCULATE APPS PER FUNCTION
(left) Project explorer > Tables > Applications Master Data.
(top) Ribbon > Home > Check out.
(center) Transform pipeline > Formulas step.
Add new numeric-type column: Apps per Function = SumIf(Application Function, Application Function, 1)
CALCULATE REDUNDANT APP COUNT
In the report: (top) Ribbon > Report > Table.
Select the newly added table.
(left) Project explorer > Tables > Applications > Application Function: Drag to Rows area in Ad Hoc Component Configuration (AHCC) panel.
(top) Ribbon > Data > Insert > Insert formula column.
Name: Redundant App Count
Enter formula: =If((Applications Master Data.Apps per Function > 1) AND (Applications Master Data.Application Function !=""), Applications Master Data.Application Count, 0)
Format: Number
Decimal Places: 0
Type: Numeric
Summable: Check box
Right-click Redundant App Count in Values area > Publish > Service Costing.
Name: Redundant App Count
Data Type: Numeric
Delete the newly added table. (Dummy table, just used for publishing Redundant App Count.)
REPORT TITLE
(top) Ribbon > Report > HTML.
In Edit Content window, paste:
<span style="font-size:x-large">Redundant Apps (>1 App Per App Function)</span><br>
Now viewing: <%=CurrentDate("MMM YYYY")%>
KPI
(top) Ribbon > Report > KPI.
Select the newly added KPI.
(left) Project explorer > Perspectives > Service Costing > Redundant App Count: Drag to KPIs area in KPI Configuration panel.
(left) Project explorer > Tables > Applications > Application Count: Drag to KPIs area in KPI Configuration panel.
Click directly on the left KPI (Redundant App Count) in the report body.
(top) Ribbon > KPI > Secondary: Application Count.
(top) Ribbon > KPI > Show/hide panels: uncheck Application Count.
DETAILS TABLE
(top) Ribbon > Report > Table.
Select newly added table.
(left) Project explorer > Tables > Applications > Application Function: Drag to Rows area in AHCC panel.
(left) Project explorer > Tables > Applications > Application Name: Drag to Rows area in AHCC panel.
(left) Project explorer > Tables > Applications > Application ID: Drag to Rows area in AHCC panel.
(left) Project explorer > Tables > Applications > Application Description: Drag to Rows area in AHCC panel.
(left) Project explorer > Tables > Applications > Application Family: Drag to Rows area in AHCC panel.
(left) Project explorer > Tables > Applications > Application User Category: Drag to Rows area in AHCC panel.
(left) Project explorer > Tables > Applications > Apps per Function: Drag to Values area in AHCC panel.
(left) Project explorer > Tables > Applications > Application User Count: Drag to Values area in AHCC panel.
(left) Project explorer > Tables > Applications > Application Function: Drag to Filters area in AHCC panel.
Right-click Application Function in Filters area > Edit.
Uncheck box for (Blank) > OK.
(left) Project explorer > Tables > Applications > Apps per Function: Drag to Filters area in AHCC panel.
Right-click Apps per Function in Filters area > Edit.
Edit filter: Greater than 1 > OK.
Right-click table border > Properties.
General > Name: Redundant Apps: Details
General > Show header: Check box
BAR CHART: # APPS PER APP FUNCTION
(top) Ribbon > Report > Table.
(left) Project explorer > Tables > Applications > Application Function: Drag to Rows area in AHCC panel.
(left) Project explorer > Tables > Applications > Application Count: Drag to Values area in AHCC panel.
(top) Ribbon > Data > Insert > Insert formula column.
Name: Multiple Apps per Function
Enter formula: =If(Application Count > 1, "y", "n")
(left) AHCC panel > Values: Drag Multiple Apps per Function from Values to Filters area.
Right-click Multiple Apps per Function in Filters area > Edit.
(bottom) Add a custom filter > Filter name: y
Uncheck all boxes except: y
(left) Project explorer > Tables > Applications > Application Function: Drag to Filters area in AHCC panel.
Right-click Application Function in Filters area > Edit.
Uncheck box for (Blank) > OK.
(top) Ribbon > Ad hoc > Bar.
Right-click bar chart > Properties.
Chart > Multicolor single series charts: Uncheck box
Chart > Reverse order: Check box
Chart > Legend location: Hidden
Data > Maximum rows: 9999
General > Name: Redundant Apps: # Apps Per App Function
General > Show header: Check box
LINE CHART: REDUNDANCY INDEX
(top) Ribbon > Report > Chart.
(top) Ribbon > Ad hoc > Line.
(left) AHCC panel > Top of panel: Select Applications as chart object context.
(left) Project explorer > Perspectives > Service Costing > Redundant App Count: Drag to Values area in AHCC panel.
(left) Prokect explorer > Time > Months (Yr): Drag to Axis area in AHCC panel.
Right-click line chart > Properties.
Chart > Legend location: Hidden
General > Name: Redundancy Index: # Redundant Apps
General > Show header: Check box
LINE CHART: # APPS PER APP FUNCTION
Right-click Redunancy Index: # Redundant Apps chart > Copy to clipboard.
(bottom right) Report clipboard > Paste all.
Click and drag pasted chart to any new location.
(left) Project explorer > Tables > Applications > Application Function: Drag to Legend area in AHCC panel.
Right-click line chart > Properties.
Chart > Legend location: South
Data > Maximum rows: 9999
General > Name: Redundant Apps: # Apps Per App Function