♦ Applies to: IT Benchmarking v.1.13.0+ (Learn more)
In this article:
Introduction
Use the multi-year trending feature in Interactive Benchmarking to compare your actuals against median benchmarks over a three-year time period. These three years include the current and prior two years. Trend over time is available for Industry Benchmark metrics and Infrastructure Benchmark metrics.
Industry Benchmarks - Benchmark Trend Over Time
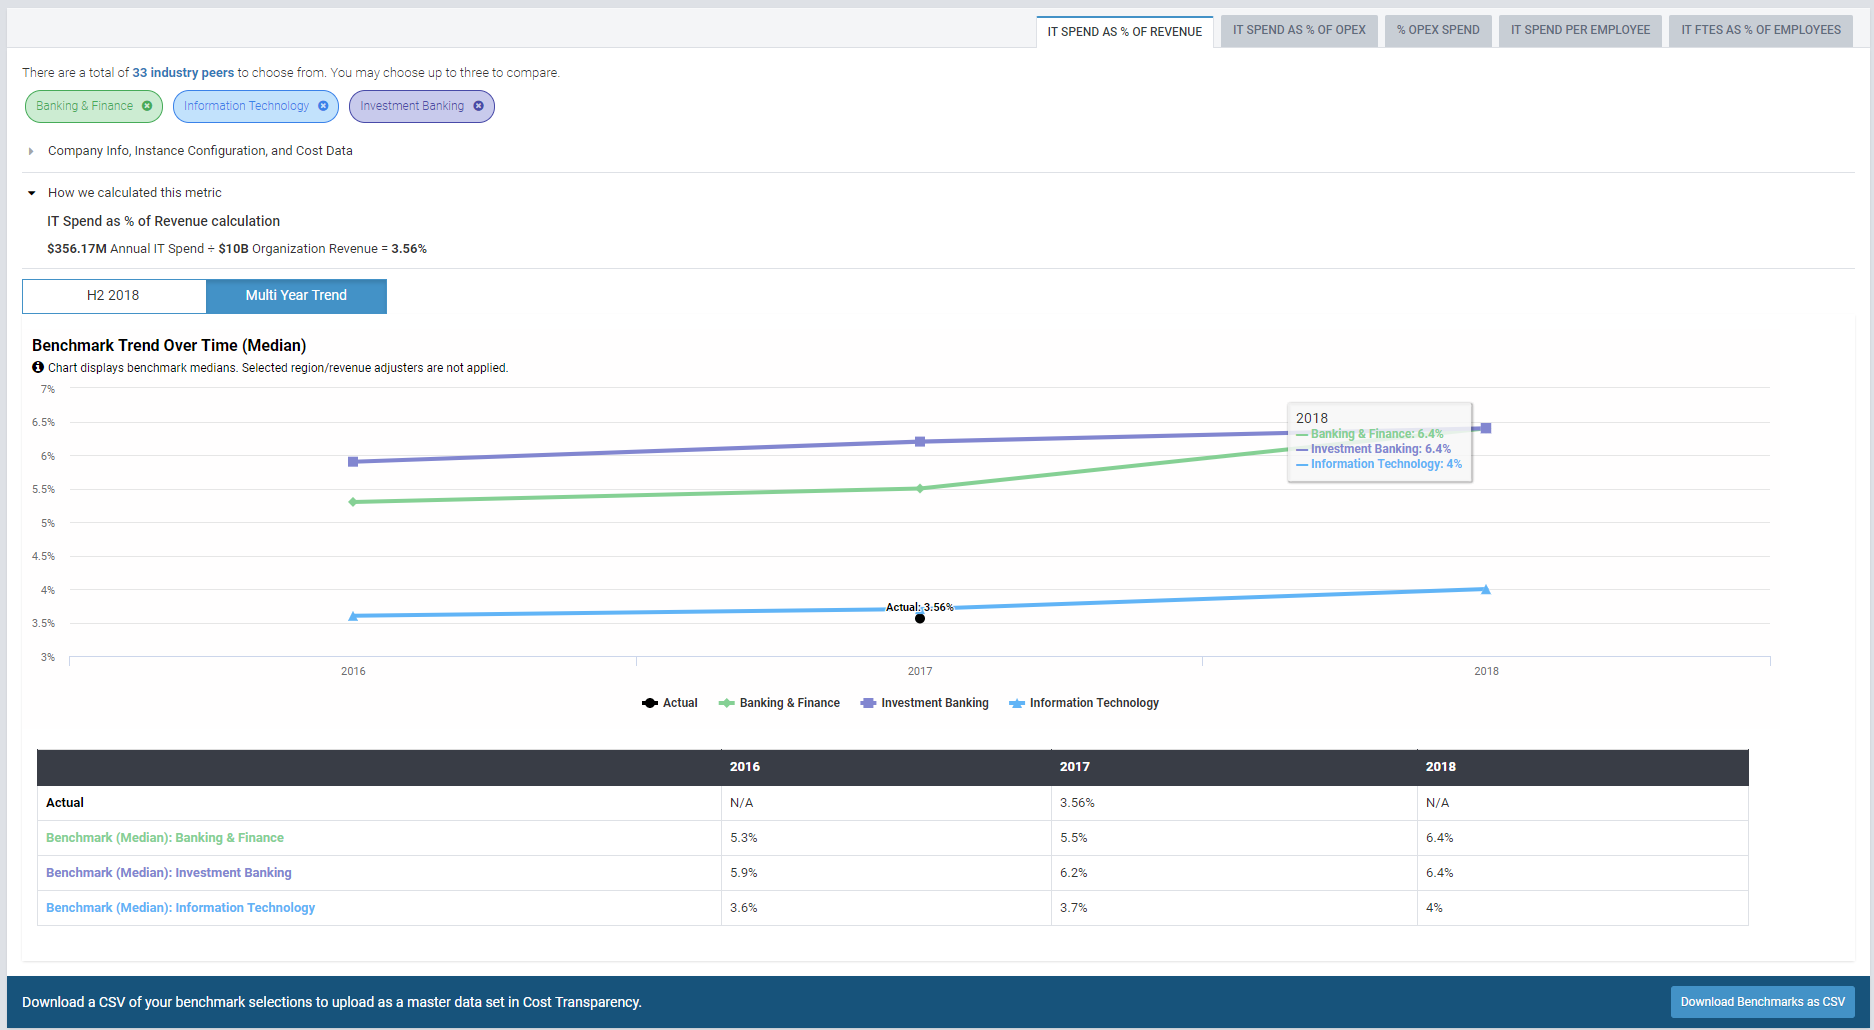
The Industry Benchmarks, Benchmark Trend Over Time (Median) looks like this:
(Click to enlarge)
The screenshot above displays the median "IT Spend as a percentage of revenue industry" benchmark for the selected industries (in this case, Banking & Finance, Investment Banking and Information Technology) for the current benchmark year (2018), and prior two years (2017 and 2016). The benchmark is displayed in both chart and tabular forms.
NOTES
- All benchmark numbers are medians.
- While industry selections are reflected in the trending chart, your region or revenue adjusters will not be carried over from the previous section.
- Actual values displayed for the year's cost data is retrieved from your Cost Transparency project.
- When benchmark data is not available for a certain industries for the given time period, no data is shown.
- When benchmark data is not available for a certain time period, no data is shown.
Infrastructure Benchmarks - Benchmark Trend Over Time
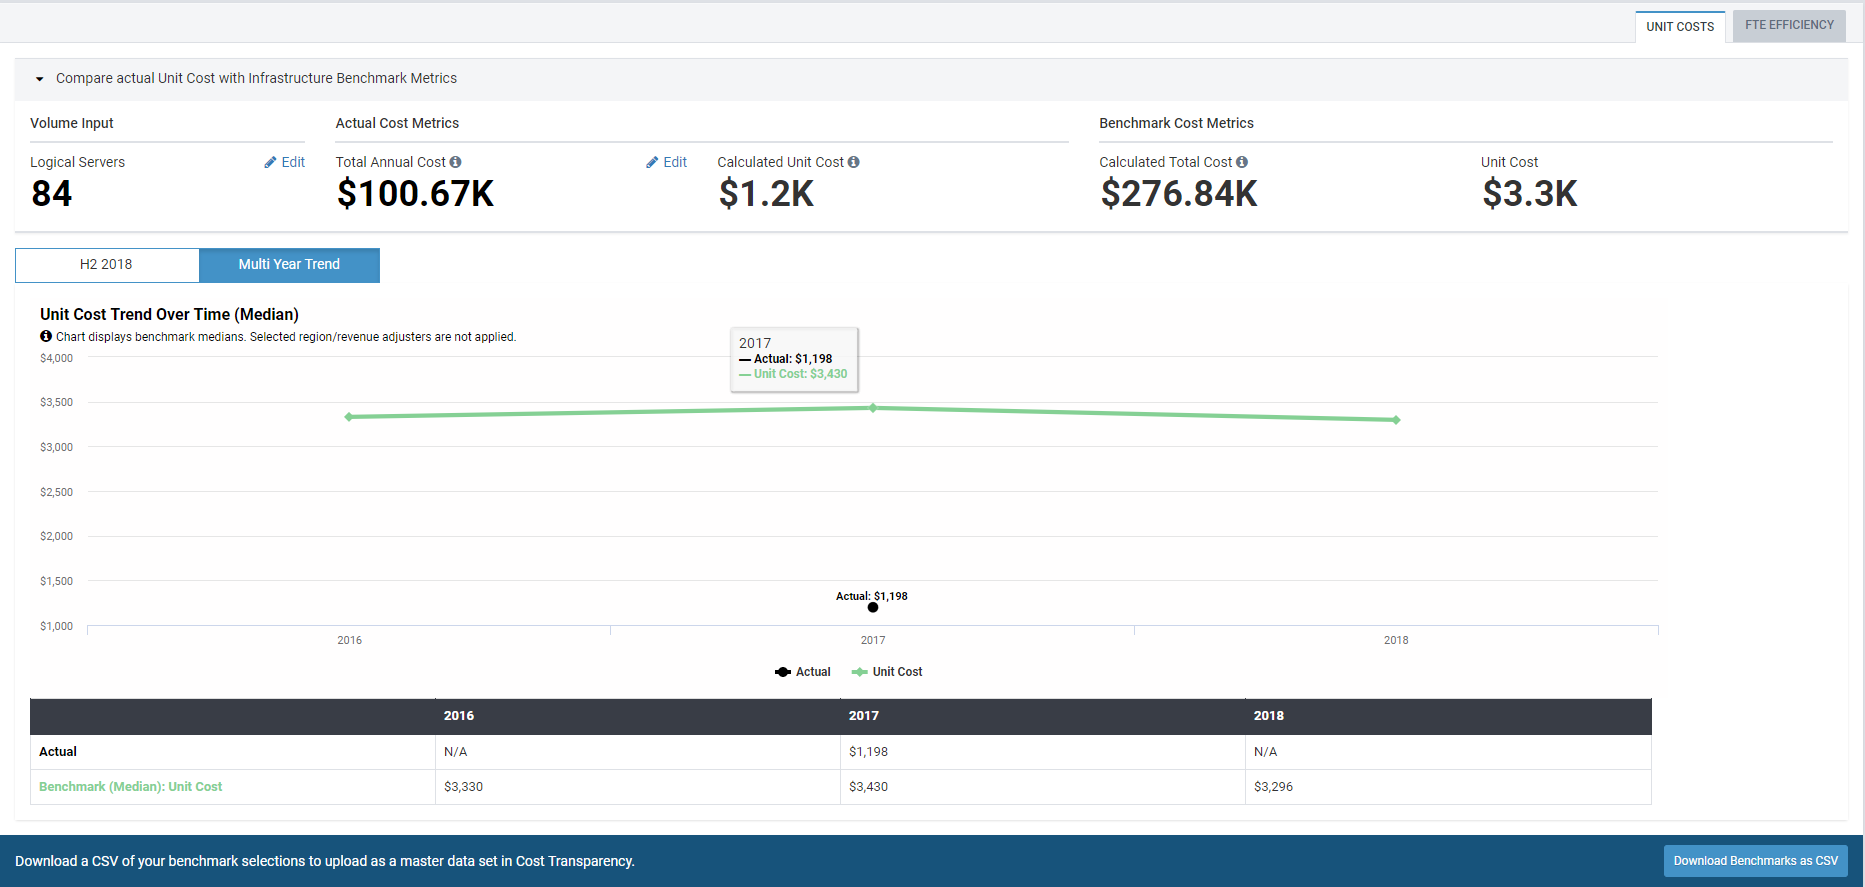
The Unit Cost Trend Over Time (Median) looks like this:
The FTE Efficiency Trend Over Time (Median) looks like this:
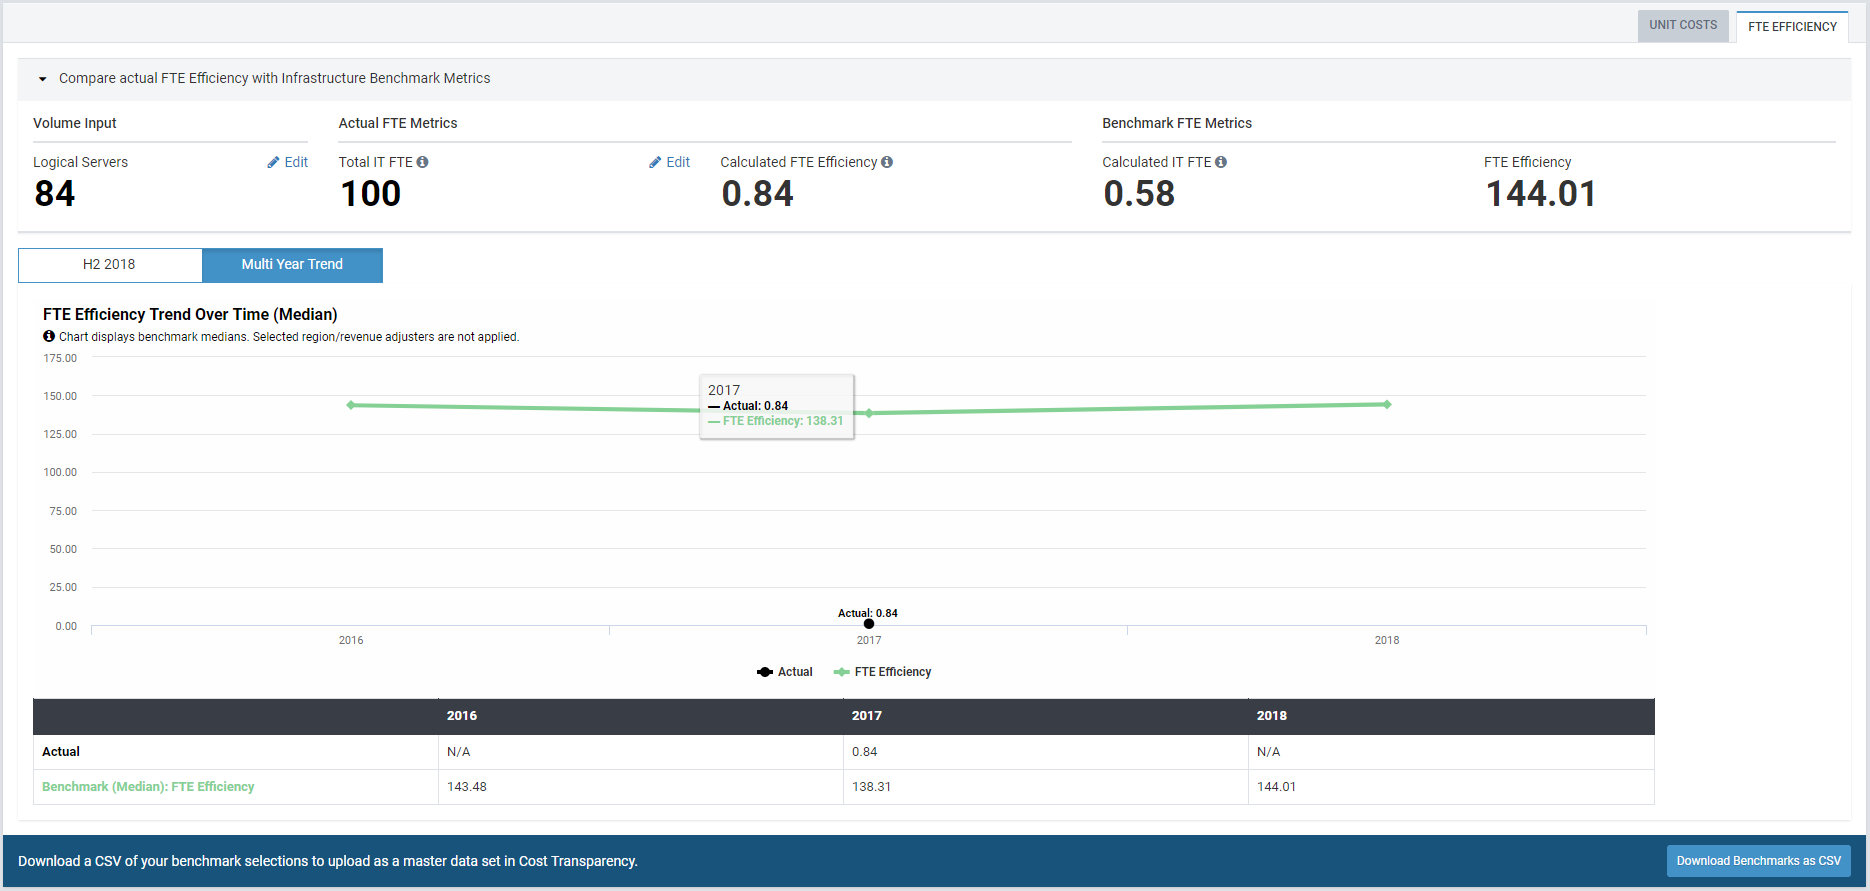
Trend over time information is available for unit cost and FTE efficiency metrics, as shown above.
NOTES
- All benchmark numbers are medians.
- Scale, Region or Industry adjuster selections from the previous section do not get reflected on the Trend Over Time chart.
- Actual values displayed for the year's cost data is retrieved from your Cost Transparency project.
- When benchmark data is not available for a certain time period, no data is shown.
This topic is open for your feedback. At the bottom of this page, click Add a comment.