by Alexandra Thornton
Ultimately we use websites to engage and inform our customers. ‘Build it and they will come’ might be our fervent desire, but customers won’t stay if they encounter a slow or unresponsive website, or if they can’t complete a shopping transaction.
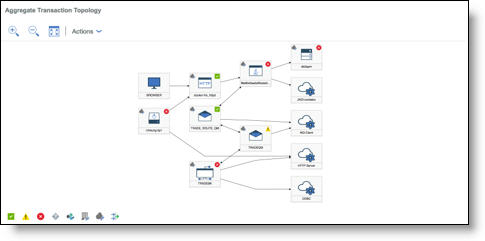
There are many aspects of your website that you might want to monitor so that you know exactly what your customers are experiencing. In particular, you should monitor HTTP transactions and browser timings for your website and transactions that flow through to the database in case that is where the problem is.
IBM Application Performance Management enables you to easily monitor and troubleshoot HTTP transactions, including browser timings. You can monitor the IBM® Java application stack to see transaction monitoring information from the browser through to the database, including resource monitoring from individual components. The IBM Java application stack includes the IBM HTTP Server, the WebSphere Application Server, and the IBM DB2® or Oracle database. In the topologies, you will see transaction monitoring information from the browser to the database, including resource monitoring from individual components.
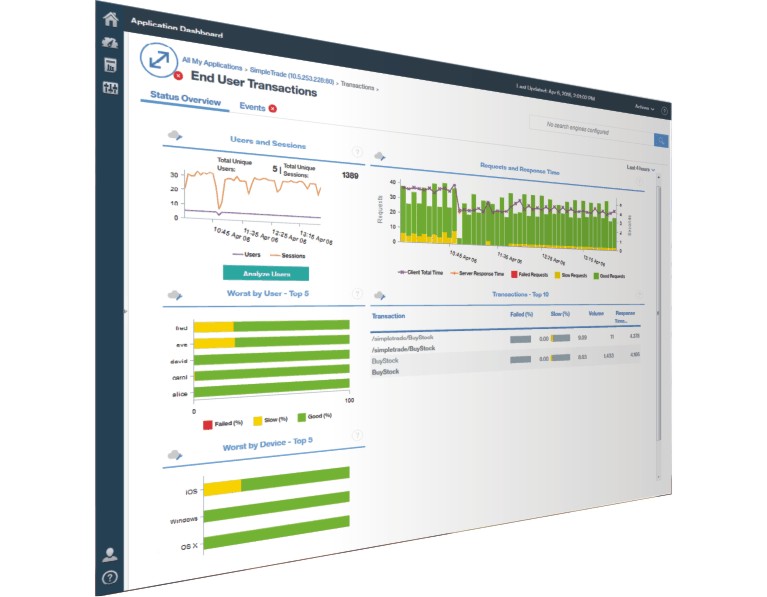
From the topology, you can drill down to further information about the customer experience. You can see who is accessing your website and view load and performance information for each user, device and session.
Your data is automatically sorted into countries, regions and cities, so that you can make sense of what is happening geographically. You can see how your website is performing for your closest neighbours and for your overseas’ customers. If your customers are experiencing problems with performance, you can see the scope of the problem and the user volumes involved.
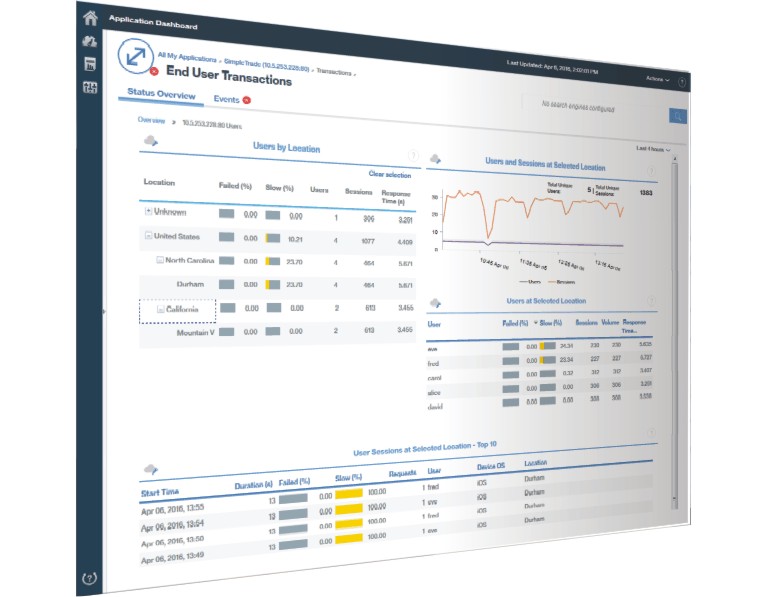
With IBM Application Performance Management you know who’s impacted and where they are. You can tell if problems are confined to a single customer, an area or affect a whole city. Can you afford not to monitor your website?
http://ibm.co/1SDvOV3