Let’s dive in and walk through the new enhancements in Dashboarding for 11.0.6 (R6)
Direct access to OLAP packagesIn the previous release (11.0.5), we provided access to relational Framework Manager (FM) packages directly from the dashboard. In this release, we expanded to OLAP based packages! This includes support for sources such as PowerCubes, Dimensionally Modelled Relational (DMR), TM1, Dynamic Cubes, MSAS and all the other supported OLAP sources. For the DMR package, the same rule applies as for relational packages, meaning that it needs to be published as DQM, unless there is also a JDBC connection defined for it.
To get going, simply right-click on the package and select Create dashboard.

The dashboard will open and display the metadata tree on the left, exposing the dimensions, hierarchies, levels and measures. We have not yet expose members in the tree view, that will be for another release coming soon.

Expand the tree to the desired dimension and simply drag in either the hierarchy or a specific level directly onto the canvas to start visualizing your data. Once the field is on the canvas, you can do all the gestures that you would expect: drill, filter, sort, top count, change viz and others.

You’ll notice that when you drag in a specific level, you can of course drill down, but you can also use the navigate option to skip levels and jump down to another one without needing to drill multiple times. This is particularly useful if you’d like to see all the children of a particular parent.

When you drag in a hierarchy, only the traditional drilling mechanisms are available where you can drill up and down. We also included a very useful filter dialog that displays the members in a tree view, allowing you to select the members you want to focus on, regardless which level they belong to.
 Widget Connections
By default, all widgets on a canvas from the same source are connected. This allows you to drag a few fields onto the canvas and quickly filter the information by simply clicking on the values inside the widgets. This is very useful when you need to find a particular value, but with the new widget connections, you can now do comparison-based analysis by disconnecting the widgets preventing them from being filtered by other widgets.
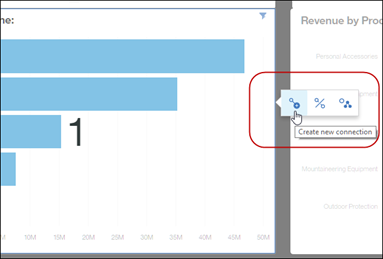
For example, perhaps you’d like to compare the values of your sales for various products against the total amount, or across another time period. To do this, position your widgets on the screen and select the Connections icon on the toolbar.

This will place the dashboard in a mode that displays the various widget groups that are currently defined. From here, you can create different group to better control which widgets will be tied together.

To assign groups, simply click on the widget and create a new group or assign it to an existing group. You’ll see the numbers change to reflect their group assignment.
All widgets with the same number and coming from the same source will respond to each other when you click on them.
In this example, we created two groups to compare sales values across different countries, and we also added a few summaries up on top of the canvas that won’t be impacted by our selections. This will allow us to compare for example Brazil sales to Canada’s as well as to the worldwide numbers.
 New Grid widget
We are introducing a new grid widget in R6 that provides improved performance when scrolling, it displays summaries per groups as well as stretches to fit the size of the widget. You can also decide to hide or show the summaries.

If you drag in fields from an OLAP source or a data module with navigation paths, the options to drill up and down will be available here as well.
 Showing nav paths in metadata tree
In the previous release (11.0.5), we introduced navigation paths to allow users to define a logical order in which to explore their data. What makes navigation paths fun to use is that they do not have to be the traditional Year > Quarter > Month type of hierarchy; it can be anything that makes sense for the user of the dashboard, perhaps start at Products then jump to Sales Reps and finally to Region, this provides a flexible and quick way to navigate through the data. In this release, navigation paths now appear under a new folder at the top of the metadata tree in the dashboard to make them more visible to the user.

You can drag any one of these fields or grab them from their original location under their respective table. Once on the canvas, whether you selected the field from the Navigation paths folder or its original table in the tree, its behaviour will be identical.
Colour slot on chartsWhen viewing a chart, you can now drag in another measure to act as a colour gradient.

This provides an excellent way for you to visualize two measures without needing another bar. In this example, we can see that while Cooking Gear may have brought in more revenue, its profit is lower than woods due to the shading of the bar.
You’ll find this new colour slot on many charts such as the bar chart, word cloud, packed bubble, radial and others.
Filtering on dates containing blanksWhen filtering on date fields that contain blanks, you will now be able to use the new filtering dialog with calendars. This is particularly useful when filtering on a field such as Shipped date for example, where a product may have been ordered, but hasn’t shipped quite yet.
On the filter dialog, you can now select <
blank> as part of the selection drop down, or to include the blank dates as part of the chart.
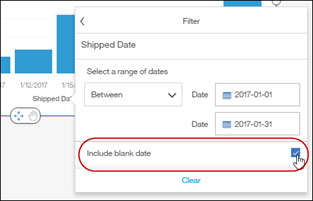
By selecting to include the blank dates, their values are placed in a single data point under the “blank” label. In the screenshot below, we are looking at all the orders for January based on their shipped date. We can see that we still have quite a few orders that haven’t shipped quite yet, representing close to $1M revenue.
 Other goodies
There are obviously lots of smaller items that have a large impact on the experience in the dashboard. Even though they are small, I wanted to highlight three of them, simply because we think they are quite useful.
- You can now sort stacked bar charts, or charts with multiple measures.
- The text widget now has a new size option called “Auto”. This will make the text shrink and grow based on the screen size and ratio. No more cropped labels when you view a dashboard on a smaller screen! Make sure to edit existing dashboards to change the size to Auto if needed.
- You can change the template of your dashboard by clicking on the tab and selecting a different one.
Head over to our trial environment to try it out. Lots of good enhancements in this release!
#11.0.6#CognosAnalytics#CognosAnalyticswithWatson#createBoard#dashboard#home#LearnCognosAnalytics