
In the middle of 2020, we have been going through a pandemic, the cause of which is COVID-19, this virus originated in China at the end of 2019 and reached Europe and America at the beginning of 2020. To date, in mid-November, there are more than 54.9 million people who have been infected by this virus and approximately 1.3 million deaths worldwide. Faced with this pandemic, different medical and technological solutions are being developed. Today, with technology we can create different tools that help us fight this virus, such as robots. Likewise, thanks to Artificial Intelligence, which helps to perform different tasks that humans do daily, such as seeing, algorithms can be developed to diagnose COVID-19 through X-rays, just as a doctor does. That is why I detail the following work.
Methodology

The methodology consists of 5 steps: Collection, Pre-processing, Modeling, Detection, and Evaluation
Data collection
The images were taken from Kaggle and contain the following distribution:

The images are about COVID-19, Normal, and Pneumonia, since most of the injuries caused by the coronavirus are very similar to the injuries found in cases of pneumonia. In total, there are 2,583 images: 577 images of coronavirus, 1004 normal and 1002 with pneumonia.
Image pre-processing
Chest radiographs or commonly known as x-ray images are used to obtain images of the internal structure of the human body, and are of various types: CT Scan (Computed Tomography), mammography, angiography, fluoroscopy, among others.
These types of images are the most widely used diagnostic tools in the medical field and allow us to see from bone fractures to pathologies in the lungs. On the other hand, these types of images have two disadvantages: the low contrast of the image and the possible additive noise that corrupts the image.
There are several filters to remove noise from images, one of them is the Gaussian filter, which allows you to stabilize the variance in an image. To improve contrast, the Contrast adapted Histogram equalization (CLAHE) technique can be used, which allows the contrast in the radiographs to increase after the noise elimination process in order to improve performance. of the classification
That is why these images must go through a pre-processing stage. It should be noted that to treat this type of images, the noise must first be removed (applying the Gaussian filter) and then improve the contrast (CLAHE), in case the contrast is improved and the noise is not removed before, it can lead to loss of information (characteristics of the images) that would worsen the quality of the images and therefore the performance of the classification.
First, the libraries are imported:
- os: allows file management
- BytesIO: allows the data to be saved in a buffer in memory
- Zipfile: allows the extraction of compressed images in a zipp
- Ibm_boto3: allows to import the zip file to the path: / home / wuser from IBM Cloud Object Storage

Secondly, a zip with 3 folders (Normal, Covid19, Pneumonia) must be uploaded to the Object Storage

Then it is inserted into code using StreamingBody Object

The images are extracted using the zipfile library and the classes are saved in an array called classes_required.
Now the images will be saved in the following path: / home / wsuser / work/

Using two for loops, the images will be iterated over and stored in an array called images.
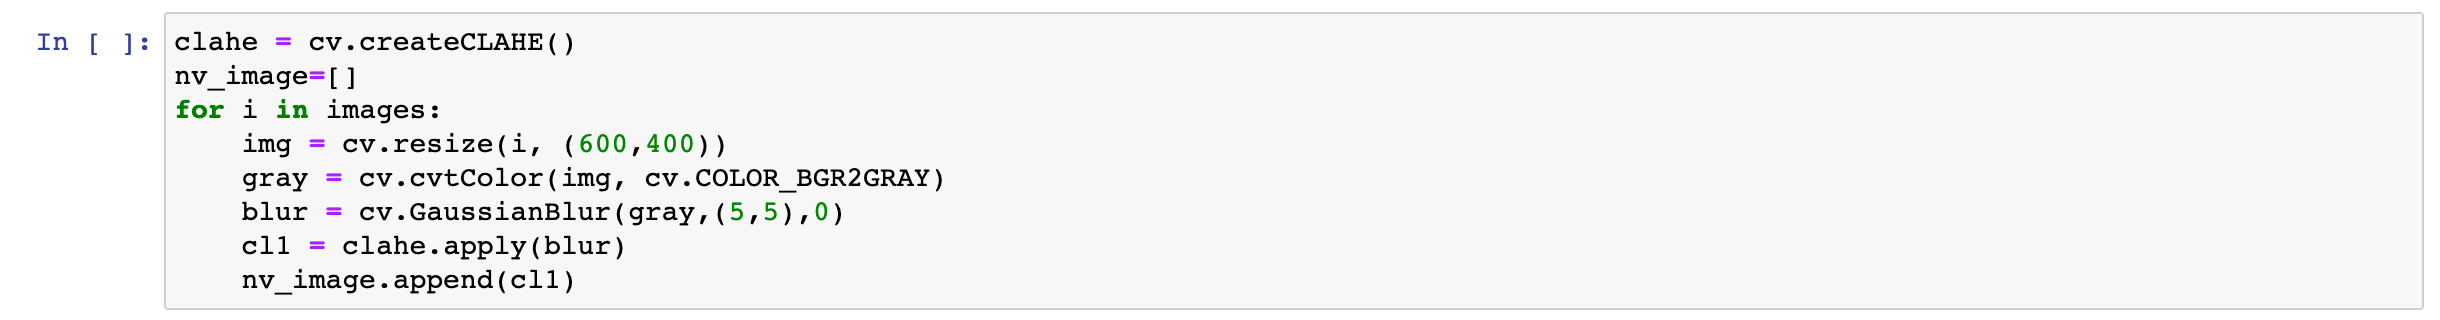
Then, an object of the CLAHE type is created that will help us to improve the contrast of the image (contrast enhancement) and through another for loop it will iterate over the images and have the following procedure:
- Converts to grayscale (cv.cvtColor (img, cv.COLOR-RGB2GRAY)
- The Gaussian filter is applied (cv.GaussianBlur (gray, (5,5), 0)) which has a 5x5 kernel
- Finally, the CLAHE function is applied to improve the contrast of the image.

Modeling
A Deep Learning architecture was used for the extraction of characteristics and the classification of the images. In this case, Visual Geometry Group 19 (VGG19) was used, which consists of 19 layers (16 convolution layers, 3 fully connected layers, 5 MaxPool layers and 1 SoftMax layer).

First, the images are saved

The following libraries are imported first:
- ImageDataGenerator (to do data augmentation).
- VGG19 (Deep learning architecture).
- AveragePooling2D, Input, Dense, Flatten, Dropout, Model to tune the model and adapt it to the three-class classification.
- SGD as the optimizer.
- to_categorical (to adapt labels to the three-class numpy format).
- train_test_split to partition the data.

Since we have the data stored in an array (nv_image), and in order, we proceed through a for loop to save the labels.

Then, the images are resized to 224 x 224 and the images are resized dividing them by 255. In addition, the labels are one-hot-encoded by means of a for loop and the to_categorical () function. The data partition is 75/25.

Using the ImageDataGenerator function, a data augmentation is performed with a rotation of 15 degrees. Then the VGG19 architecture is loaded to do transfer learning with the ‘imagenet’ weights. It should be noted that the architecture is modified and a GlobalAveragePooling layer is added, a Fully-connected layer of 514 neurons and a dropout of 0.5. Because there are 3 classes, the softmax function is used.

The learning rate was = 0.001, 100 times and a batch_size of 64
Coronavirus detection
Object detection is a task of computer vision that involves detecting objects within images or videos. In this case, lesions indicating the presence of coronavirus were detected using the IBM Cloud service, Visual Recognition.

It is important to note that the labeling process was carried out by a radiologist with more than 15 years of experience, who worked in various hospitals in Peru as well as in private clinics. As we can see in Visual Recognition we load the images and select the Add object button to draw a square where the lesions are located.

After labeling the images, press the train model button.

After the model trained, the apikey and the url are extracted.

With the apikey and url extracted, we proceed to implement the Visual Recognition model in an IBM Watson Notebook. To do this, the libm_boto3, Config and ClientError libraries are imported (to be able to access the IBM Cloud Object Storage)
To test the model, you must upload a zip with new images (testing2.zip) and import your credentials and the ICOS SDK (IBM Cloud Object Storage).
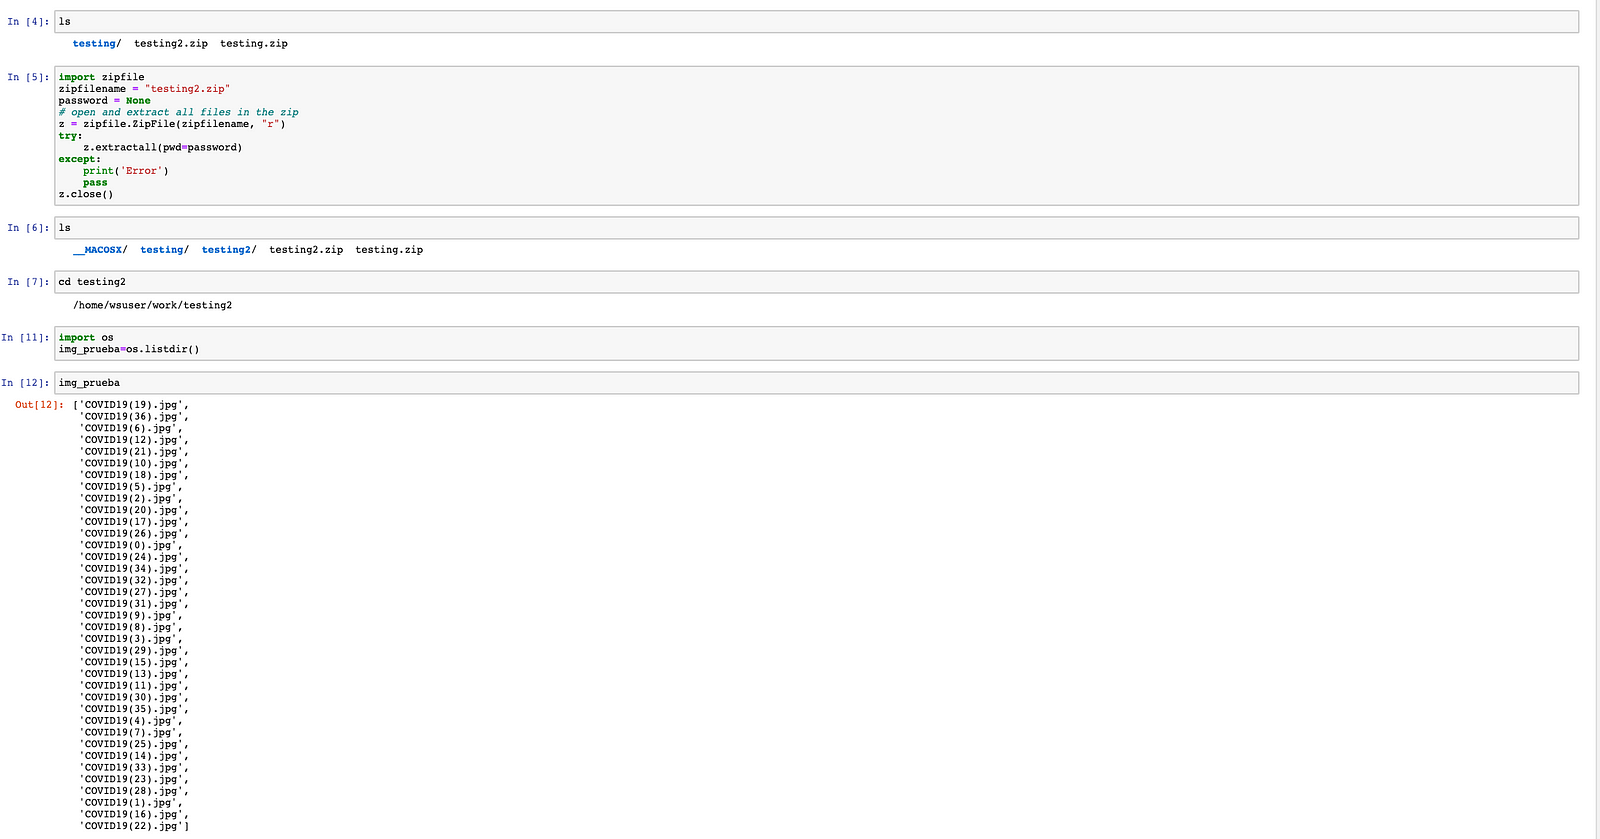
Using the ls command, it was seen that the zip was already within the path. For this reason, zipfile was imported and the images inside the zip were extracted. With the library you obtained the name of the images that were inside the zip.

Then the virtual recognition model is instantiated with the url and the apikey

To perform the detection, a for loop was used that went through the images and took out the coordinates of the bounding boxes predicted with the visual recognition model.

Finally, with another for loop, the bounding boxes were drawn in the images and the class to which it belongs.

Este es el resultado final, muchas imagenes con sus respectivos bounding boxes.
Evaluation

The VGG19 obtained good results in the four metrics (accuracy, recall, precision and f1-score).

In the confusion matrix we can see that the model classified few images incorrectly.


Finally, we see in the graphs that the accuracy and loss show that the model generalized the data distribution relatively well. However, this can be improved by having more images and thus reducing the loss significantly.


#GlobalAIandDataScience#GlobalDataScience