Greetings,
I need to create a dashboard in BPC like the below screen shot :
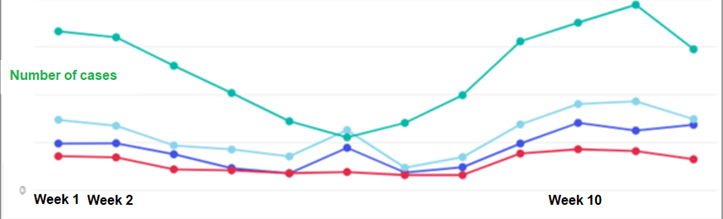
These 4 different color lines are representing 4 different users who are working on different cases. Is it possible to have this kind of visualization in BPC ?
I created a line chart which shows total number of cases in the system via a single line but now I want to plot cases per users(4 users) in the same line chart via 4 different lines
Thanks
------------------------------
Lakshya Agarwal
------------------------------