Monitoring virtual systems data on IBM Cloud Pak System Software Monitoring portal
Overview
IBM® Cloud Pak System is an integrated, highly scalable system that is based on IBM X-Architecture, providing an application-centric computing model in a cloud environment. IBM Cloud Pak System uses workload patterns that enable the deployment of complex business applications in a cloud environment.
System Monitoring shared service
IBM Cloud Pak System provides shared service – a predefined pattern that provides certain runtime services to multiple applications for example System monitoring shared service. The System Monitoring shared service provides the monitoring infrastructure that allows monitoring agents to collect performance and availability information. You can use this information to troubleshoot your system and make business decisions regarding your hardware and service usage.
Monitoring data for virtual systems
In this blog, you will learn how to monitor virtual systems data (for example, CPU and Disk usage) on IBM Cloud Pak System Software Monitoring portal, using System monitoring shared service running in internal mode, through IBM Cloud Pak System.
This blog provides a sequence of steps to achieve the goal as follows:
- Deploy a System Monitoring shared service in internal mode
- View the status of the System Monitoring shared service
- Access IBM Cloud Pak System Software Monitoring Portal
- Deploy Virtual System
- Monitor virtual system data in IBM Cloud Pak System Software Monitoring Portal
Pre-requisites
- System Monitoring pattern type (V1.0.20.0) available and enabled on IBM Cloud Pak System V2.3.3.4
- Oracle Java 8 update 281 installed and configured
Deploy a System Monitoring shared service in internal mode
- Click Patterns > Shared Services
- Expand the Monitoring Services
- Select System Monitoring 1.0.20.0 and then click Deploy
- Configure the specific properties for the shared service
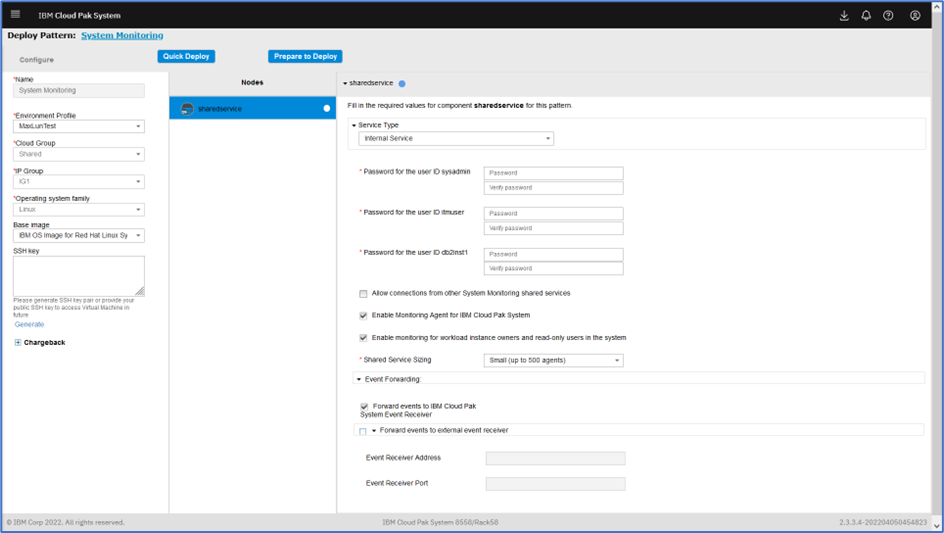 Figure 1 : Deploy System Monitoring Shared Service
- On the left pane of the page, select environment appropriate values for:
- Environment profile
- Cloud Group
- IP Group
- Operating system family
- Base Image
- On the right pane of the page:
- Let the Service Type be Internal service.
- Enter passwords for these users: sysadmin, amuser, and db2inst1.
- Do not select the “Allow connections from other System Monitoring shared services” checkbox.
- Keep default selections for rest of the fields on the page.
- Click Quick Deploy for single systems. For a multisystem setup, click Prepare to Deploy and select placement of the virtual machines
This deployment should be completed in about 30 to 45 minutes.
View the status of the System Monitoring shared service
Click Patterns > Shared Service Instances.
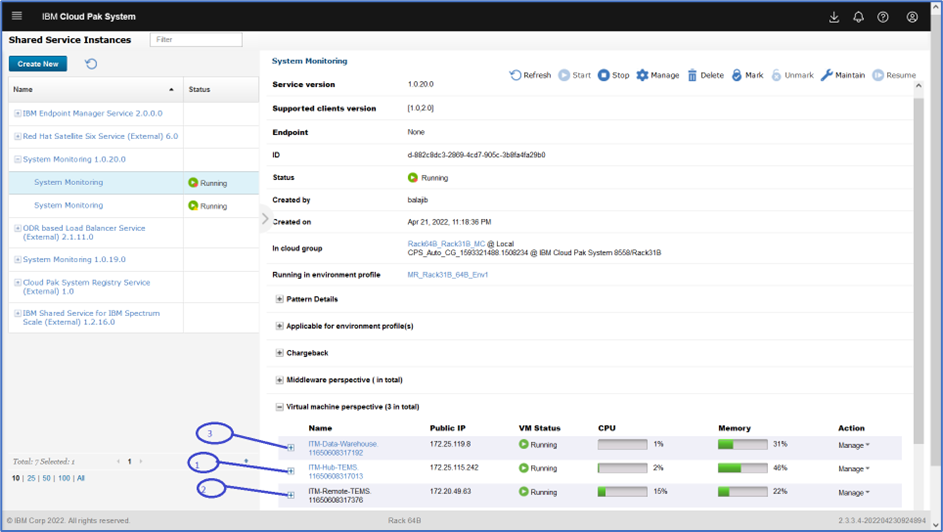
Figure 2: System Monitoring Shared Service Instance
A running shared service instance of System Monitoring is available as shown Figure2.
The shared service instance of System Monitoring consists of virtual machines by hosting:
- A hub monitoring server
- A remote monitoring server, a Cloud Pak Software Agent
- A data warehouse
Access IBM Cloud Pak System Software Monitoring Portal
Before you open the IBM Cloud Pak System Software Monitoring Portal, ensure that:
- Oracle Java™ Version 1.8 Update 281 is installed on the computer
- Add IP address of Hub Monitoring server to the hosts file, which is located in %SystemRoot%\system32\drivers\etc\hosts (Windows) or /etc/hosts (UNIX) directories
To open IBM Cloud Pak System Software Monitoring Portal:
- Go to the shared service instance of System Monitoring that you deployed earlier.
- Expand the virtual machine ITM HUB TEMS and click Endpoint (refer to Figure3a and 3b).
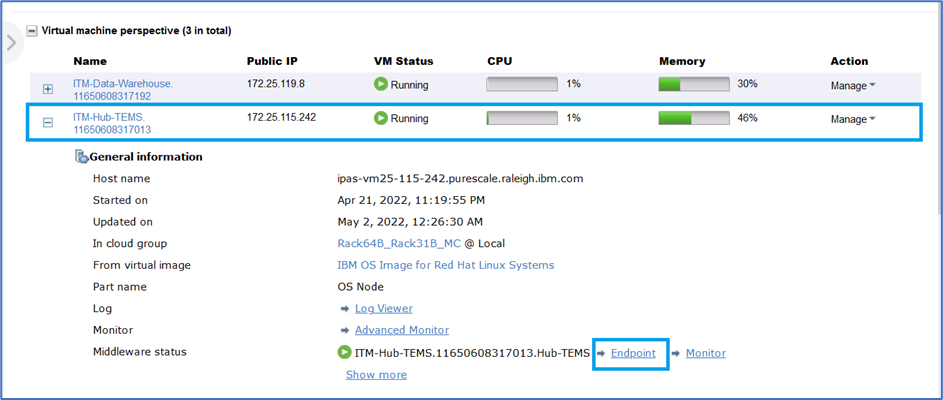
Figure 3a: Endpoint for IBM Cloud Pak System Monitoring Portal
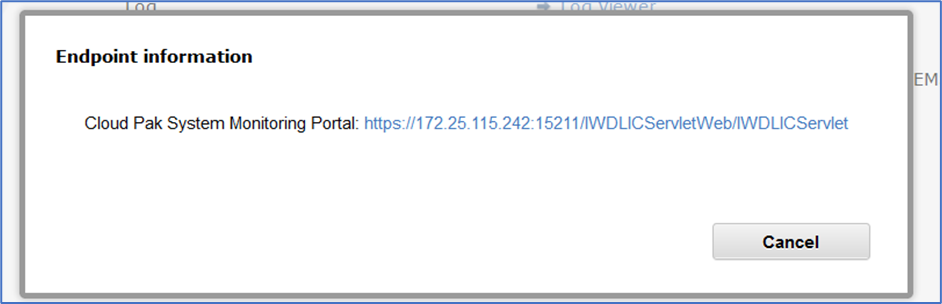
Figure 3b: Endpoint info for IBM Cloud Pak System Monitoring Portal
- Click the URL that is mentioned in Figure 3b.
- This action downloads a file LICServlet in the Downloads section on your computer.
- Select LICServlet, right-click and select the Open With
- Go to the path where Java is installed, select the javacpl file, and click Open.
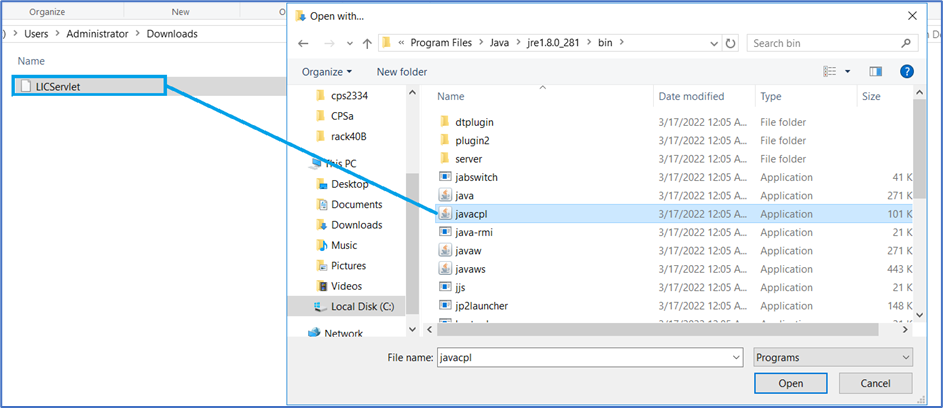
Figure 4: Open LICServlet file
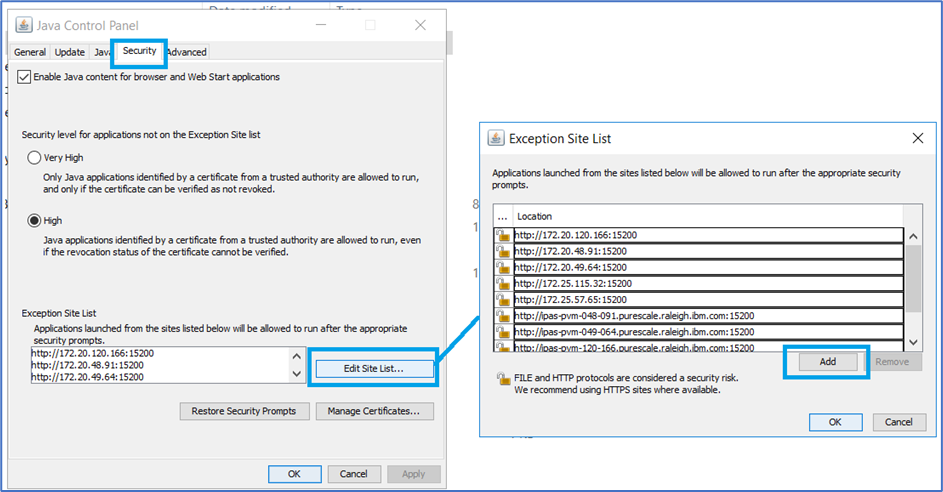
Figure 5: Enter IP and Hostname for HUB TEMS in Java Control Panel
- On the Java Control Panel, click Security tab, and then click Edit Site List.
- Click Add on Exception Site list
- Make entries for IP address and hostname for HUB TEMS virtual machine in the format http://<IPaddress>:15200 and http://<hostname>:15200.
- Click OK.
- Open the LICServlet file again but with the javaws
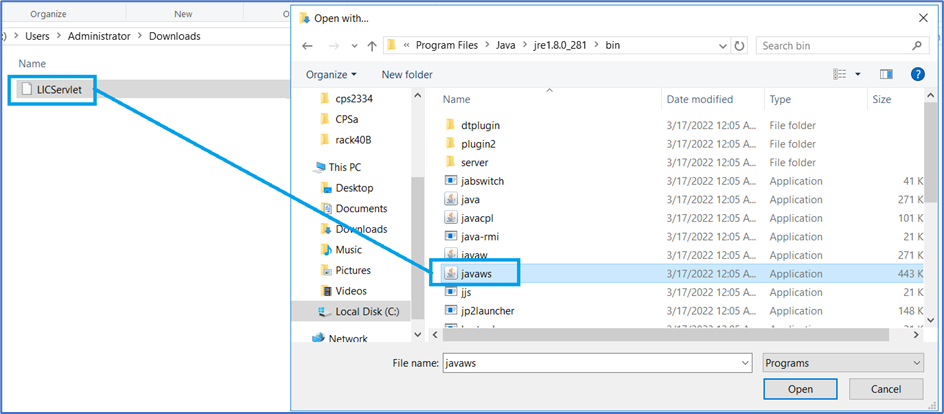
Figure 6: Open LICServlet with javaws
- Follow sequence of screenshots from figure 7 to 12 to open the Monitoring portal.
 Figure 7
Figure 8
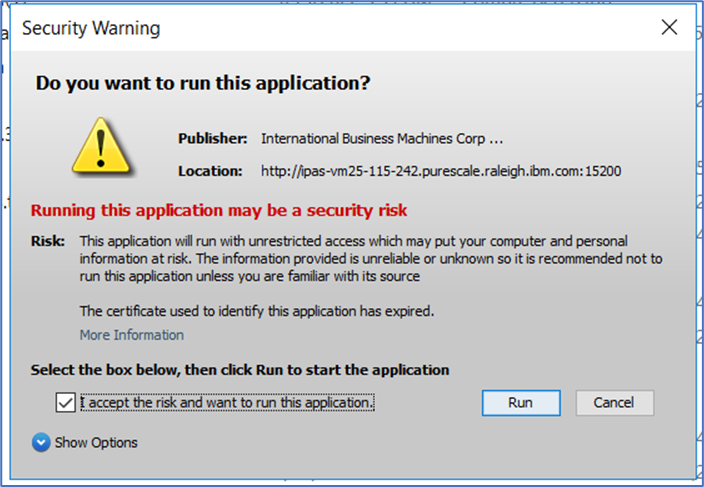
Figure 9
Figure 10
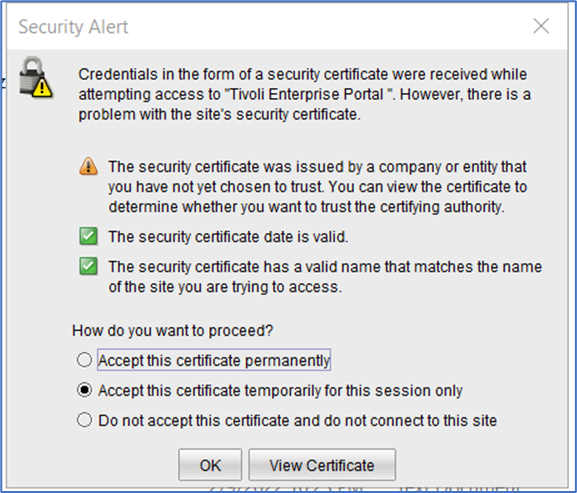
Figure 11
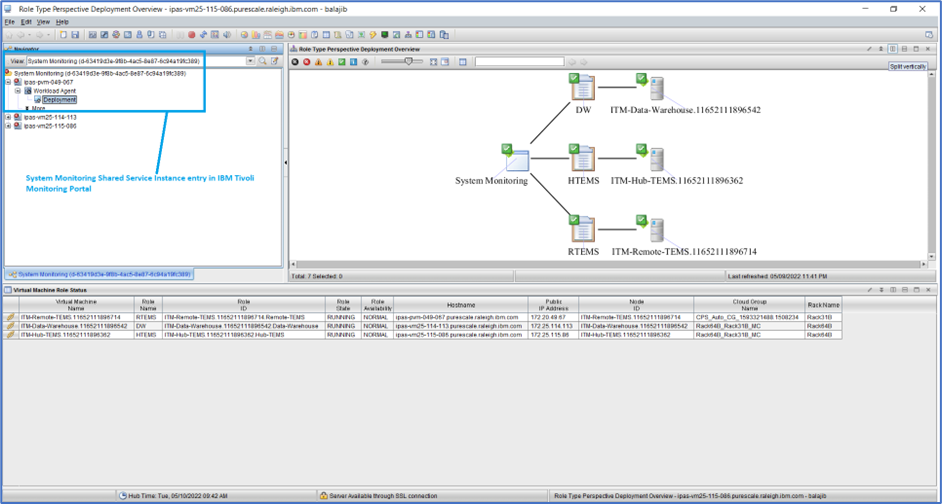
Figure 12: IBM Cloud Pak System Software Monitoring Portal
IBM® Cloud Pak System Software Monitoring Portal gives you access to the data that is collected by the monitoring agents.
Deploy Virtual System Pattern instance
- Go to Patterns > Virtual System Patterns and then click Create New.
- Enter name for your pattern and click Start Building
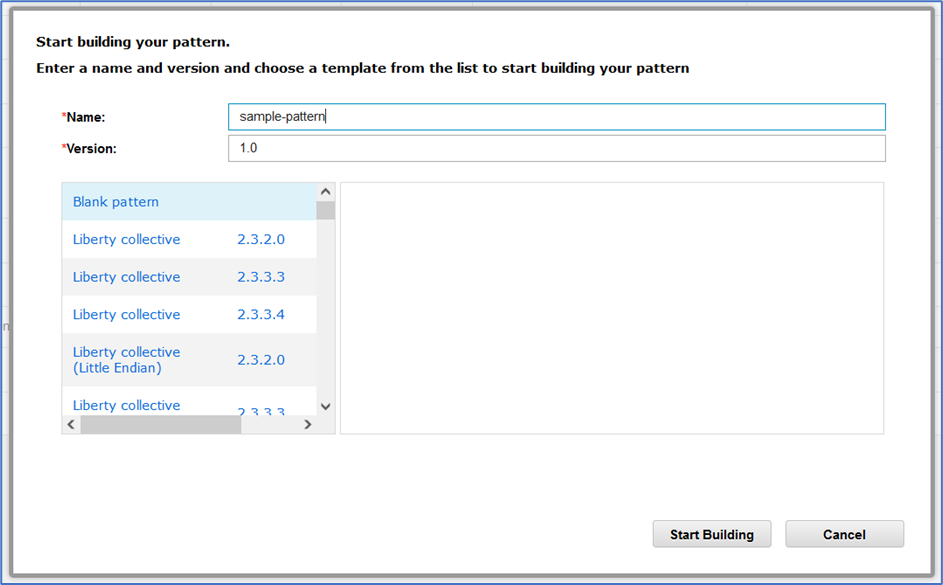
Figure 13: Build new virtual system pattern
- Select two OS Node components in Pattern Builder and save the pattern

Figure 14: Build Sample Pattern
- Now sample pattern is ready to deploy two virtual machines. Do these steps:
- Search for “sample pattern” in the virtual system patterns list and click Deploy.
- Make sure to select the environment profile that is same as System Monitoring shared service instance when you are deploying the sample pattern instance.
After the deployment, the monitoring agents on the virtual machines that are created as a result of the deployment automatically connect to the System Monitoring shared service and collect performance and availability data for the deployed virtual systems.
Monitor virtual system data in IBM Cloud Pak System Software Monitoring Portal
- Open IBM Cloud Pak System Software Monitoring Portal as mentioned in the step Access IBM Cloud Pak System Software Monitoring Portal.
- Click the Navigator dropdown list
The deployed virtual system “sample-pattern” is now seen in the Navigator dropdown list as shown in Figure 15
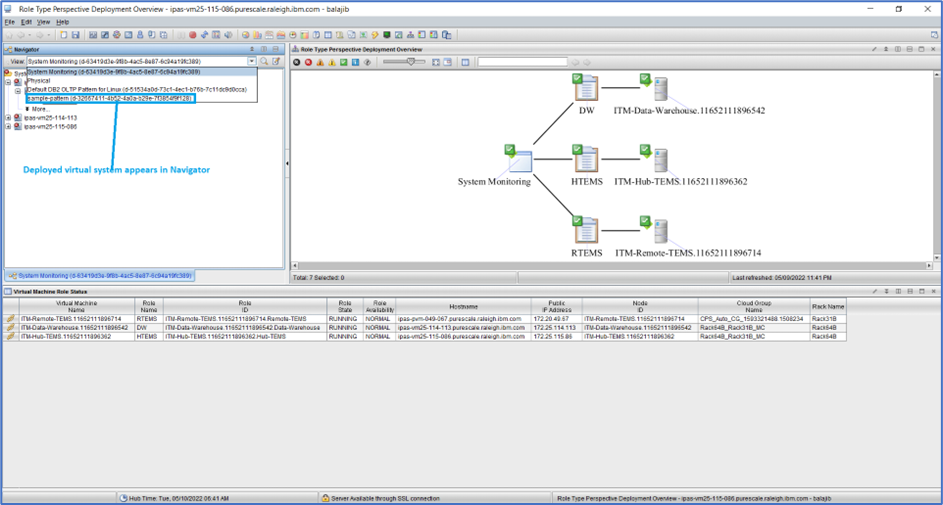
Figure 15: Virtual system entry in IBM Cloud Pak System Monitoring Portal
- Select the “sample-pattern” virtual system from the dropdown list.
- Select and expand one of the virtual machines that is listed and expand Linux OS
As a user, you can see attribute groups for the selected virtual machine
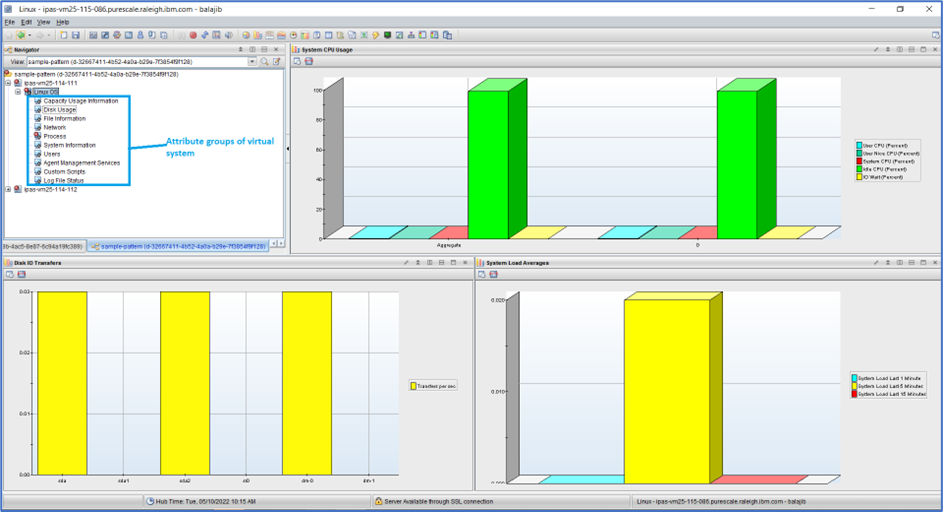
Figure 16: Attribute group for virtual machine
- Click the attribute group to view corresponding data that is collected for that group. For example, Capacity usage information
Figure 17: Capacity usage information for selected virtual machine
Disk usage data
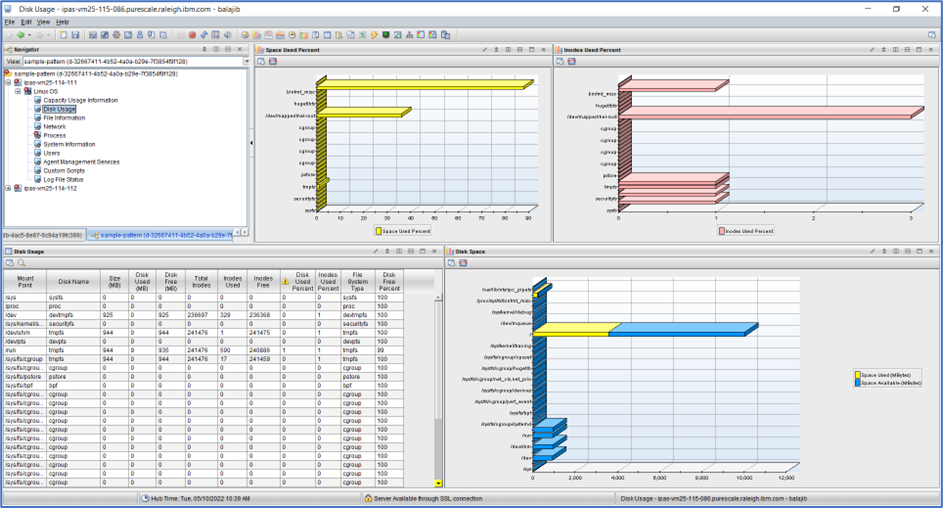
Figure 18:Disk usage data for selected virtual machine
Using the data for various attributes, an administrator can remediate alert situation for the virtual system.
Troubleshooting
For issues that are related to opening IBM Tivoli Monitoring Portal, refer to the Access IBM Cloud Pak System Software Monitoring Portal section.
For other issues, please contact IBM support.
Refer to the following IBM Cloud Pak System documentation link for more information about System Monitoring:
https://www.ibm.com/docs/en/cloud-pak-system-w4600/2.3.3?topic=services-system-monitoring-shared-service