AVOID GUARDIUM DATABASE FULL ISSUES
If your IBM Guardium database reaches capacity, your operations will fail. It is important that you prevent this from becoming a critical situation. As an administrator, it is imperative that you pay attention to the symptoms and alerts that indicate your database has a problem.
There are several REASONS this can happen:
- Spikes in the data being captured
- A policy setting that logs too much data in the internal database
- Storing too much data on the internal database
- Collecting data from too many databases (S-TAPs)
You might see some of the following SYMPTOMS when the Guardium internal database is getting full:
- System Monitor’s DB Utilization section shows DB Available % approaching 100%
- Aggregation errors, purge errors, and significant amount of data older than the purge period
- Alerts indicating the DB size is getting larger
- Cannot log in to the GUI
- Tomcat error on the GUI
- GUI purge is not working
You might consider using the
IBM Guardium Alerts: Database Full troubleshooting decision tree tool published in the Security Learning Academy. Enroll for FREE using your IBM ID.
PREVENTION IS KEY
We have gathered some information to help you take preventative steps to avoid this issue, and to maintain the general health of your Guardium environment. These are things to check in your environment, in no particular order.
Alert notifications
Configure alerts to notify you when the database is getting full.
- One of the most important preventative steps you can take is to set up alert notifications that trigger when your database usage goes above a certain threshold
- This allows you time to react to the condition before it is too late to take meaningful action
Resources:
Appliance patch levels
The latest patches contain fixes that might help with purge and other application issues that can lead to a database full condition.
From the CLI, type the command
show system patch installedFrom the GUI, navigate to
Manage > Maintenance > General > Installed PatchesResources:
Purge period
Check that the purge period is not too large.
- Go to Manage > Data Management > Data Archive
- Check the Purge Data Older Than setting
- The higher this number, the more data is kept on the appliance
- Adjusting the purge period depends on your environment requirements
- This action has a direct impact on the database utilization
- This should be set back after a successful purge
- Check Allow purge without exporting or archiving to ensure older data is cleared
Resources:
Auto stop services
Turn auto_stop_services on.
From the CLI, type the command
show auto_stop_services
- This setting is set to on by default
- When the database gets to 90% full, the sniffer on the collector automatically stops along with other internal services
- You should not turn this setting off or circumvent it by restarting stopped services or you could end up in a database full state
Resources:
Database percent used
Check the database utilization.
From the GUI, navigate to
Manage > System View > System Monitor > DB Utilization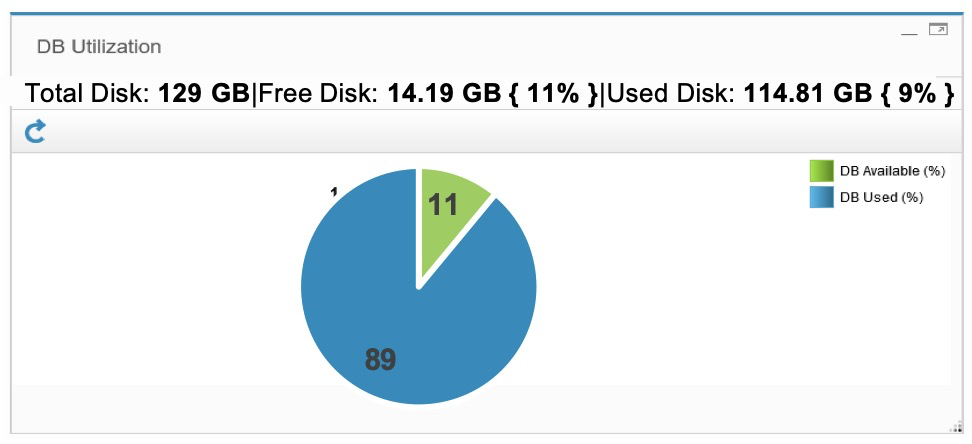
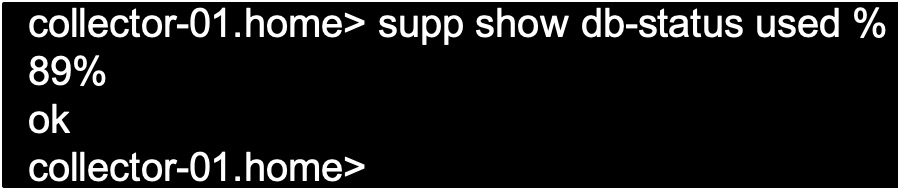
From the CLI, type the command
supp show db-status used %
If database space is high, consider the following actions:
- Purge
- Check that the scheduled purge has been running
- Check purge settings and adjust as needed
- Run a manual purge
- Policy tuning opportunities
- Minimize LOG FULL DETAILS and ALERT PER MATCH actions
- Maximize IGNORE STAP SESSION actions
- Moving high-traffic S-TAPs to another collector
Top database tables
You can determine the reason the internal database fills up by analyzing the largest database tables.
Each table has different processes that make it grow and different strategies for managing its size.
From the CLI, type the following commands:
show db-status free % show db-top-tables allYou can reclaim space in tables by purging data using the GUI (preferred) or using the CLI.
Resources:
Reports
Check reports to see how data in tables is spread across time.
- Create Sessions per Day report
- Create Policy Violations per Day report
- Additional useful reports to consult which is accessed by navigating to Comply > Reports >
- Logged R/T Alerts
- Logged Threshold Alerts
Resources:
Aggregation / archive log
Check the Aggregation / archive log for errors.
- Check that the purge is scheduled to run and is completing successfully
- Check the state of archive/export jobs
- Collector: Exports and/or archives are completed
- Aggregator: Archives have completed
- To confirm the purge status, right-click export or archive jobs and drill down to the Details report
You can consult the archive log and much more via the CLI
1. Run:
support must gather agg issues 2. Run:
fileserver <YOUR LOCAL IP> 3500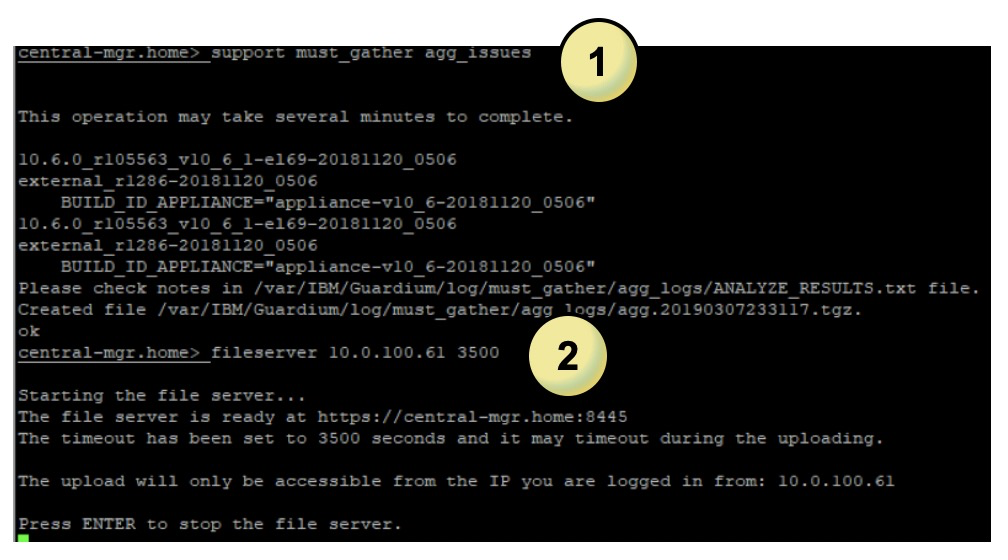
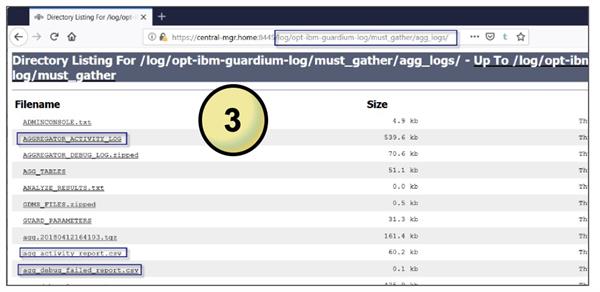
3. Navigate your browser to
https://<YOURLOCALIP>:8445/log/opt-ibm-guardium-log/must_gather/agg_logs/
- Useful files to consult as a starting point:
- Aggregator_Activity_Log
- agg_activity_report.csv
- agg_debug_failed_report.csv
Resources:
Policy tuning
Check your policies to minimize unnecessary logging.
- A policy is one of the biggest factors in how much data is coming into the appliance
- Check that the policy minimizes unnecessary logging
- Log full details actions
- Alert per match actions
- Use policies that contain Ignore S-TAP session actions
Resources:
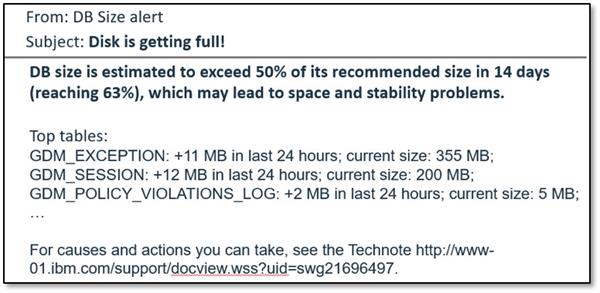
Disk and database health analyzer
Disk & Database Health Analyzer is a process that predicts and alerts Guardium admins when disk space usage and database usage size poses a risk in the upcoming 2 weeks or less.
- Alerts the user ahead of time when /var disk usage is expected to reach over 50% in 2 weeks
- Alerts the user ahead of time when database disk usage is expected to reach over 50% in 2 weeks
- Highlights largest files and database tables
- Alerts admins with insights that can lead to corrective actions
Example email alert:
Resources:
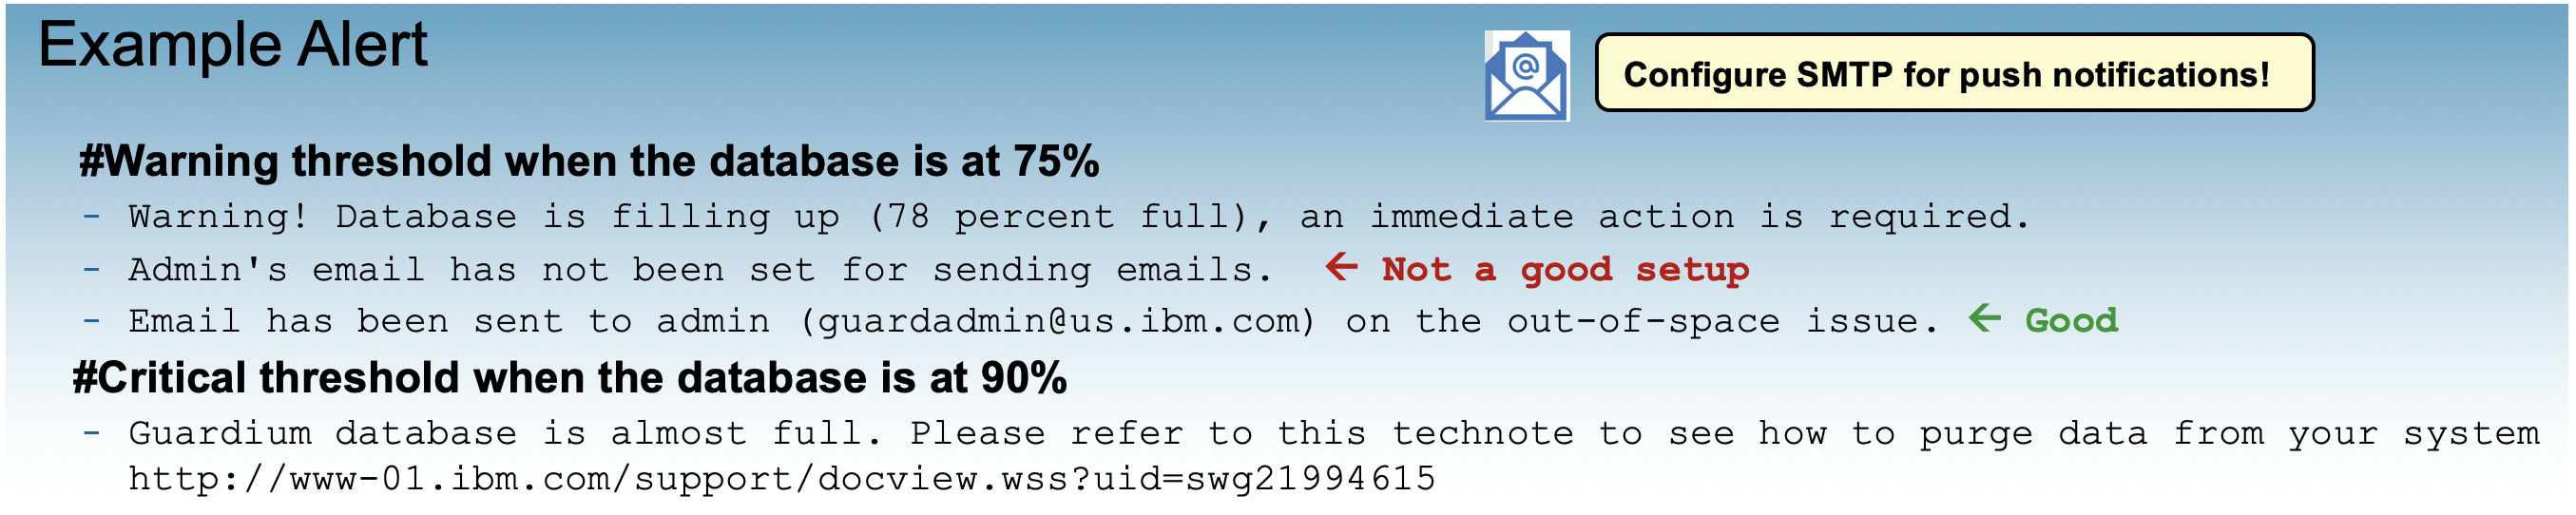
Guardium Nanny and database space alerts
Guardium Nanny is an internal process that monitors and alerts against critical system resources including database space.
- By default, all nanny alerts are written to the Guardium system log (syslog)
- It is highly recommended to configure SMTP settings in the Alerter component so you get the alert via email
I would like to thank all of the Guardium experts for the videos, technotes, and documentation mentioned here.