Recording and Viewing message flow data on CP4I
This blog details the setup and configurations for recording and viewing message flow data on CP4I.
To know about how to record and view message flow data in on-premise please see the article Recording data from knowledge center.
Note: CP4I does not support the full Record and Replay capability at the moment. We do support the "Record" capability but the "Replay" currently relies on an Integration Server with a local MQ server which is not currently supported.
Purpose:
Recording messages will be useful for the following:
- To keep audit record of messages passing through message flow
- Keep history of messages for development and testing purpose
- Help analyze problems in message flow
Pre-requisites:
- ACE message flow with Monitoring events defined and enabled.
- MQ to publish/subscribe the events to a topic.
- A database to store the recorded data.
Detailed steps for creating and configuring databases to store recorded data can be found in below link
https://www.ibm.com/docs/en/app-connect/12.0?topic=data-creating-configuring-database-recording.
Environment Details:
- ACE Operator Version: 5.1.0
- ACE Fixpack level: 12.0.5.0
- MQ version: IBM MQ V9.2.0.1
- Oracle DB: Oracle Database 12c Enterprise Edition Release 12.1.0.2.0
Note: The Oracle DB used in this demo/blog is running in On-Prem system.
Configurations:
MQ:
1. Create a ConfigMap “rr-configmap“ from openshift web console to define the queues and channels on the queue manager
rr.mqsc:
DEFINE QLOCAL('IN') REPLACE
DEFINE QLOCAL('OUT') REPLACE
DEFINE QLOCAL('SUBQ1') REPLACE
DEFINE QLOCAL('SYSTEM.BROKER.DC.RECORD') REPLACE
DEFINE QLOCAL('SYSTEM.BROKER.DC.BACKOUT') REPLACE
ALTER QMGR CHLAUTH(DISABLED)
DEFINE CHANNEL('ACECLIENT') CHLTYPE (SVRCONN) SSLCAUTH(OPTIONAL)
DEFINE SUB(MONSUB1) TOPICSTR('$SYS/Broker/+/Monitoring/#') DEST('SUBQ1')
2. Create a Queue manager and specify/attach the configmap we created at step 1.
Create queue manager:
Queue manager name: RRQM
Attach the configmap created at step1 by giving Item as rr.mqsc
For further information on how to create a configmap and how to create a queue manager from openshift web console, refer https://community.ibm.com/community/user/integration/blogs/amar-shah1/2021/12/13/deploying-a-queue-manager-from-the-openshift-web-c
Here are the details of Queue Manager we created now:
- Queue Manager Name: RRQM
- Queues for applications - IN, OUT, SUBQ1, SYSTEM.BROKER.DC.BACKOUT, SYSTEM.BROKER.DC.RECORD
- Channel for Communication with the application - ACECLIENT
- MQService and Listener port: rrqm-ibm-mq/1414
And the QueueManager yaml looks like below:
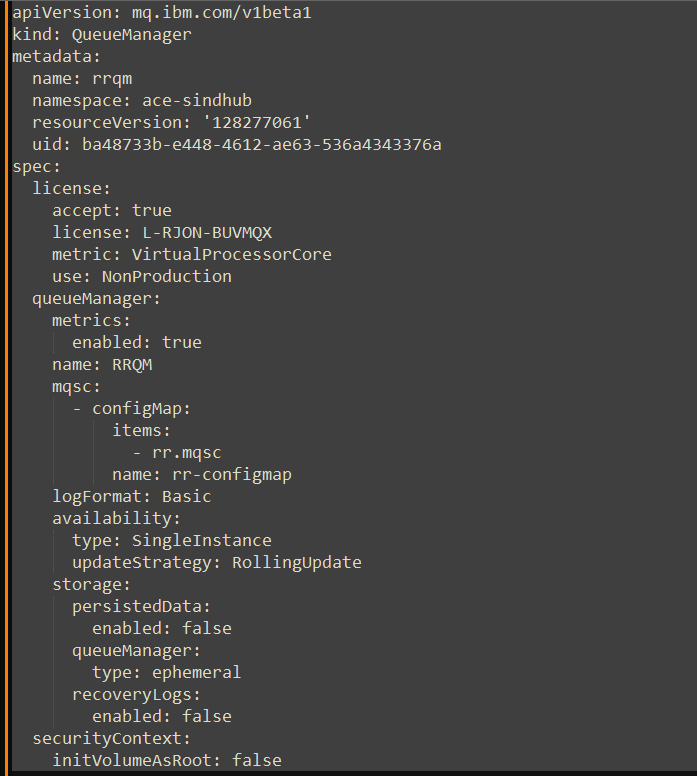
ACE:
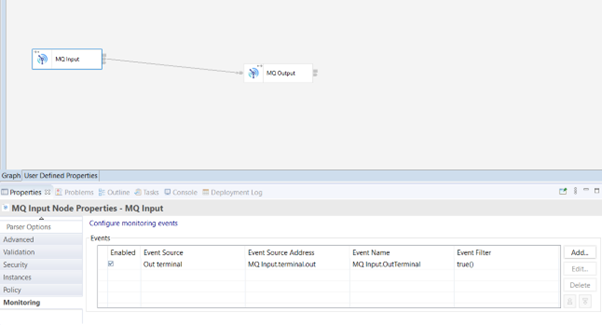
1. In this blog, we are creating a simple MQInput --> MQOutput flow using toolkit. 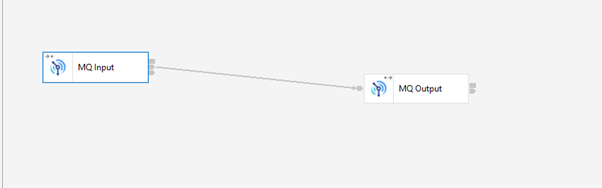
2.
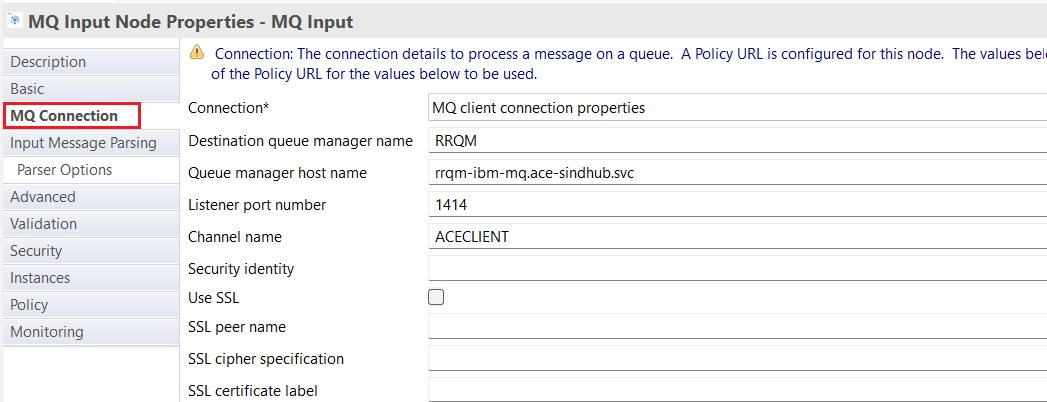
Configure MQConnection properties - Can be done either by adding the node properties or by using MQEndpoint policy.
- Add the details for both MQInput and MQOutput nodes as below:
OR
- Configure MQ Endpoint policy to specify the details about remote queue manager.
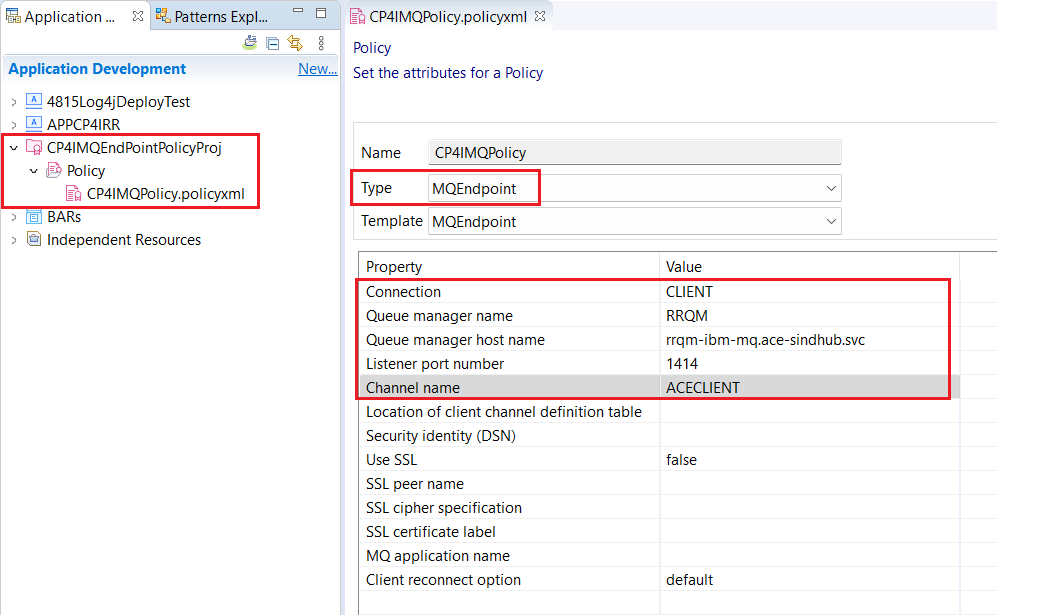
- Add the policy project name in the ‘Policy’ property of both MQInput and MQOutput nodes.
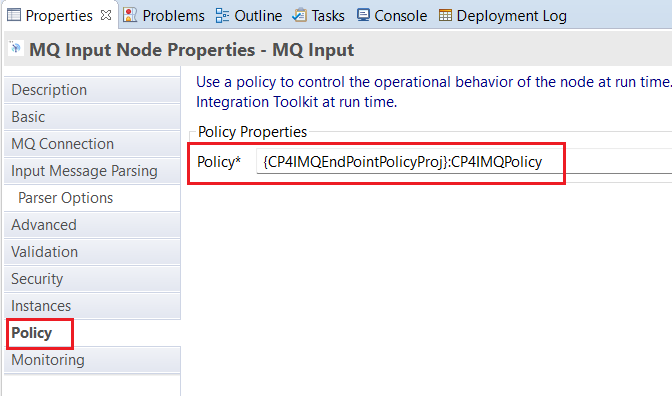
Refer “Re-configuring from local to remote queue managers” section of https://community.ibm.com/community/user/integration/blogs/amar-shah1/2022/01/05/moving-an-integration-that-uses-ibm-mq-onto-contai for more details on how to do this.
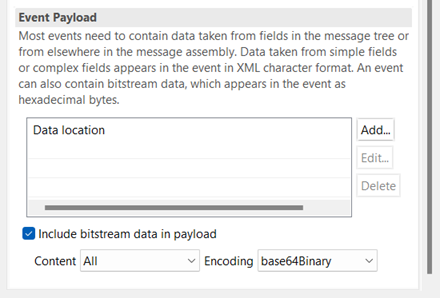
3. Define and enable monitoring event for MQInput node’s Out terminal as below:
Make sure the check box ‘Include bitstream data in payload’ under Event Payload section is ticked while configuring the monitoring event
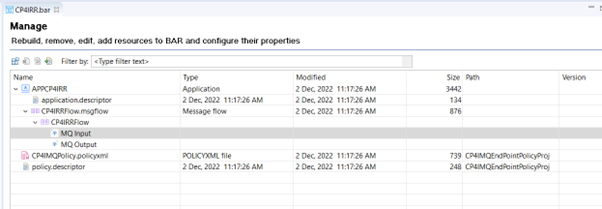
4. Save the flow and create a bar file ‘CP4IRR.bar’ containing the message flow and MQ Endpoint Policy project if you are using one.
Deploy Integration server on CP4I Environment
1. Open ACE dashboard.2. Create below listed configuration files.
2.1. Credentials (mqsisetdbparms)
Create a file called "setdbparms.txt" with the following contents updating the details accordingly
odbc::<datasource name> <uid> <password>
Where <datasource name> is the name of the stanza in the odbc.ini file. For example:
odbc::MBRECORD my-user-id my-password
2.2. odbc ini file
To specify parameters needed to connect to a database using the ODBC standard.
Here is a sample odbc.ini for Oracle:
;# Oracle stanza
[MBRECORD]
Driver=/opt/ibm/ace-12/server/ODBC/drivers/lib/UKora95.so
Description=DataDirect ODBC Oracle Wire Protocol
HostName=my-machine.hursley.ibm.com
PortNumber=1521
ServiceName=my-oracle-service
CatalogOptions=0
EnableStaticCursorsForLongData=0
ApplicationUsingThreads=1
EnableDescribeParam=1
OptimizePrepare=1
WorkArounds=536870912
ProcedureRetResults=1
ColumnSizeAsCharacter=1
LoginTimeout=0
EnableNcharSupport=0
;##########################################
;###### Mandatory information stanza ######
;##########################################
[ODBC]
InstallDir=/opt/ibm/ace-12/server/ODBC/drivers
UseCursorLib=0
IANAAppCodePage=4
UNICODE=UTF-8
2.3. server.conf.yaml
Create ‘server.conf.yaml’ file with configuration for enable monitoring, refer to the MQEndpoint policy and data store to store the recorded messages as below:
---
Monitoring:
MessageFlow:
publicationOn: 'active'
Events:
BusinessEvents:
MQ:
policy: '{CP4IMQEndPointPolicyProj}:CP4IMQPolicy'
enabled: true
remoteDefaultQueueManager: '{CP4IMQEndPointPolicyProj}:CP4IMQPolicy'
RecordReplay:
recordReplayEnabled: true
Stores:
MBRECORD_store:
dataSource: 'MBRECORD'
schema: 'myschema'
storeMode: 'all'
#queue: 'SYSTEM.BROKER.DC.RECORD'
#backoutQueue: 'SYSTEM.BROKER.DC.BACKOUT'
#useCoordinatedTransaction: false
#commitCount: 10
#threadPoolSize: 10
#commitIntervalSecs: 5
Sources:
MBRECORD_source:
topic: '$SYS/Broker/+/Monitoring/#'
store: 'MBRECORD_store'
2.4. Policy project:
- Export the policy project created under "ACE configuration" section from toolkit to a zip file.
- Create a policy project and attach the policy project zip ( RRCP4IMQEndPointPolicyProj.zip)
3. Create integration server from ACE Dashboard.
- Add/attach the bar file ‘CP4IRR.bar’ created under "ACE configuration" section.
- Select all the configuration files created in Step-2 of
"Deploy Integration server on CP4I Environment" section.
4. At minimum, for our simple flow used in this blog, define the following values and leave remaining fields to their defaults.
- Name of Integration Server
- Version of ACE fixpack
- Select appropriate License from drop down list
- Set number of Replicas to 1
The integration server yaml will look like this:

Recording and viewing message flow data:
1. Start the integration server.
To confirm the message recording is configured correctly, look for below message in Integration server pod log:
BIP2159I: Integration server 'rrcp4i' is now recording data for the following RecordReplayStores: 'MBRECORD_store'.
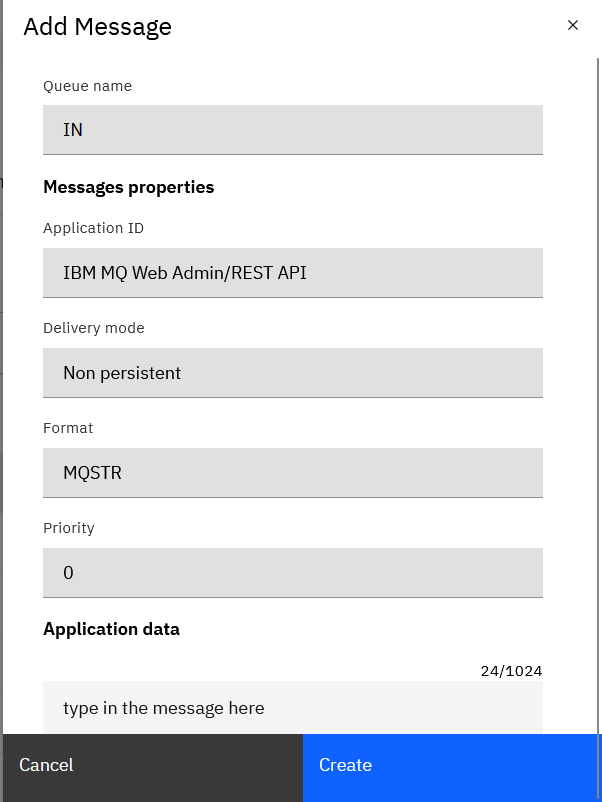
2. Process the message flow by putting some message into MQ Input queue.
- To do this, open MQ console,
- click on the three dots against the input queue,
- select ‘create message’ option
- type in the message in ‘application data’ section
- Click on create.
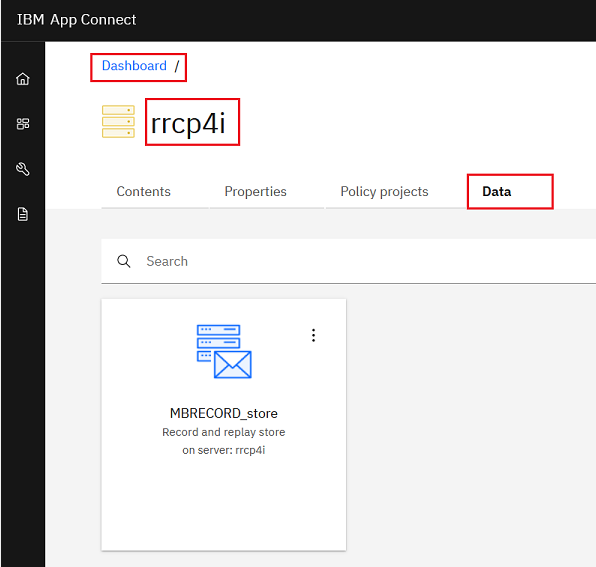
2. View the recorded data
- open the integration server
- Click on ‘Data’ tab
- Open the record store (‘MBRECORD_store’ in this blog) containing the recorded data.
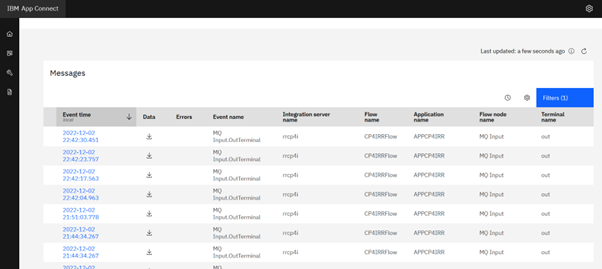
- Each row that is displayed represents a recorded message.
- You can create and apply a query to filter the list of messages in the record store.
- You can show message creation times in either Coordinated Universal Time (UTC) or local time.
- You can download the bitstream data for a message by clicking the arrow in the Data column.
Conclusion:
We have seen the configurations required to record the message flow data and how to view the recorded data via ACE dashboard.