Many customers have asked what the major outcome difference is between Machine Learning enabled AIOps solutions and traditional advanced monitoring and automation.
Today, customers have more than 10-20 performance monitoring tools for systems management including logs, metrics, and trace data. Why are there still so many complex, hard-to-solve performance issues? Can Machine Learning add a new lens to speed up problem solving?
Challenge/Problem
Based on our discussions with customers, their remaining challenges include:
- Most complex problems or outages take 3-4 weeks of time to pinpoint the root cause; some remain unsolved puzzles or a mystery.
- High CPU and resources on demand; unpredictable workload surge.
- More complex hybrid business applications span across mainframe and open systems through many middleware components, difficult to determine where the bottleneck and root cause is.
- Current tooling is specialized more for silo subject use, lack of holistic insights to pinpoint or predict problem impact relevant to the system and application operations.
Customer’s current solution/workaround
- Monitoring rules rely on human knowledge to pre-define the thresholds for alerting. If you did not configure what to be alerted on, you might miss unforeseen symptoms.
- Quote from a global credit card company: “We have twelve monitoring tools and automated alerts via email and text messages. Our systems are managed well (most time), but we still encountered outages. Managers look for proactive and preventive solutions.”
- We may have thousands of metrics and log messages to monitor from a single dimension, there could be too many alert notifications, to a point that the operators had to ignore some alerts.
Proposed solution
The proposed solution is to provide a more “holistic” view for overseeing the systems and applications health, not only through the KPIs and event messages, but also with the capability of behavior analysis and the ability to point out relevant indications.
Machine Learning and Artificial Intelligence technologies automate behavior analysis leveraging a broad scope of system KPIs and log contents in real-time, while comparing to the historical baseline. This enables IT teams to look at issues from various lens and changes the traditional way of relying on subject matter experts to set thresholds using traditional monitoring solutions.
The recent release IBM Z Anomaly Analytics with Watson delivers AI embedded measurement for system key performance indicators (KPIs) including z/OS, CICS, IMS, DB2, MQ, and z/OS System log message anomaly detection. Additionally, the embedded topology feature provides a logical map of interrelationship between subsystems and z/OS. The product highlights how solutions can deliver out-of-the box AI/ML results, without requiring the manual and often complex data science efforts in building a model.
You, as the problem solver, can now be empowered with AI/ML insights as a trustworthy reference source added to the traditional performance monitoring tool stack, enabling a broader and deeper understanding of your core system health.
We are privileged to work with our clients and research lab to develop and deliver AI/ML solutions. The intent is to share the user experience through a series of blog topics. The following scenario is intended to be a strawman to start this AI use case blog series, to illustrates how IBM Z Anomaly Analytics with Watson (IZAA) can bring AI/ML embedded system management to the next level.
Actions/Usage scenarios
Usage scenario #1
A financial services client use case
We often have performance slow-down issues, sometimes it can be so severe that it brings down the system, and we had to recycle the system.
PoC purpose
To prove how IZAA and IBM Z Log and Data Analytics (ZLDA) can bring added value for problem solving these performance issues.
Approach
We collected one month of SMF100 data from the customer and used IZAA (ML-enabled product) to train an ML model and ran IZAA out-of-the box scoring to assess potential anomalous behaviors.
We also collected a few discovered “problem days” of SMF data and SYSLOG, ingested data to IZLDA (analytics tool) for detailed content / trend analysis.
Results
IZAA – ML scoring results (holistic view #1 obtained from AI/ML outcome)
SMF Metrics:
CPU – No major anomalies in DB2 system address spaces compared against one-month history.
DB2 DDF – No out-of-norm anomalies; max DBAT thread workloads were under the norm.
DB2 latch counters – Out of 33 DB2 internal latch suspension KPIs, there are indications that DB2 encountered excessive latch suspensions in buffer pools, EDM pool, and stored procedure/authentication. The following figure 1 illustrates IZAA scoring for DB2 latch counter_23 which indicated unusual spikes in Buffer Pool latch suspension trend, latch requests for a page or deferred-write at 2:03pm encountered 758 suspensions, which gave us a clue for possible CPU contention during that time interval.
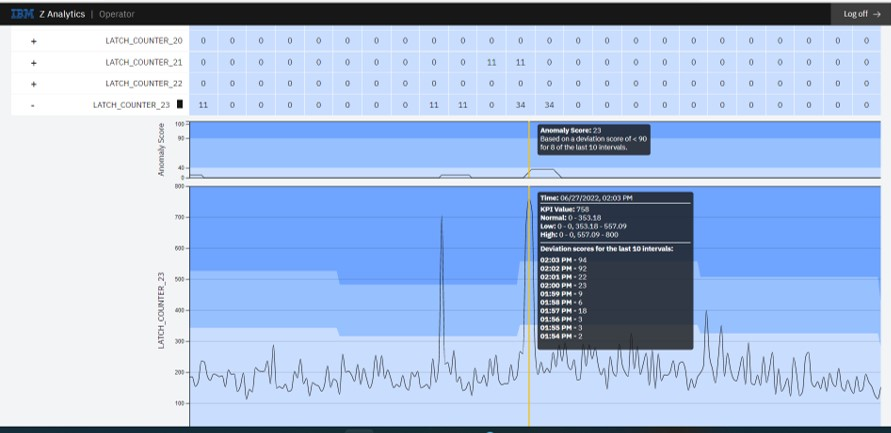
Figure 1: IZAA auto-detects anomalous behavior trend for 33 DB2 internal latch counter suspensions
Action 1 / Inferencing
This leads us to ask, why were latch suspension counts so high? This implies that Db2 did not have enough CPU to handle the requests. However, the ML scorecards show CPU in DB2 address spaces seemed normal when compared against the model (which was built based on the data in June, per client that month, every day was a bad day over that month).
Our next action is to examine deeper into the CPU usage trend.
IZLDA – Analytics results (holistic View #2, using modern Analytics tool for logs and SMF data analysis)
CPU – This time we looked at the top 5 z/OS jobs using CPU, the data source was processed from SMF type 30 records.
- The sampling trend showed Db2 DDF address space was the top CPU consumer, but the other top 10 consumers were FTP jobs, or sometimes CICS jobs, especially during a spotted problem time range.
- Db2 DBM1, Db2 MSTR, and Db2 WLM CPU utilization were ranked significantly lower than the other top 100 or top 200 jobs.
Figure 2 from IZLDA illustrates that out of the top 5 CPU jobs dominating the processor consumption, DB2 DIST (distributed data facility services) took the first place, but neither DB2 DBM1 (internal data management services) nor DB2 MSTR (CPU required for logging and subsystem management) were on the top 5 list.
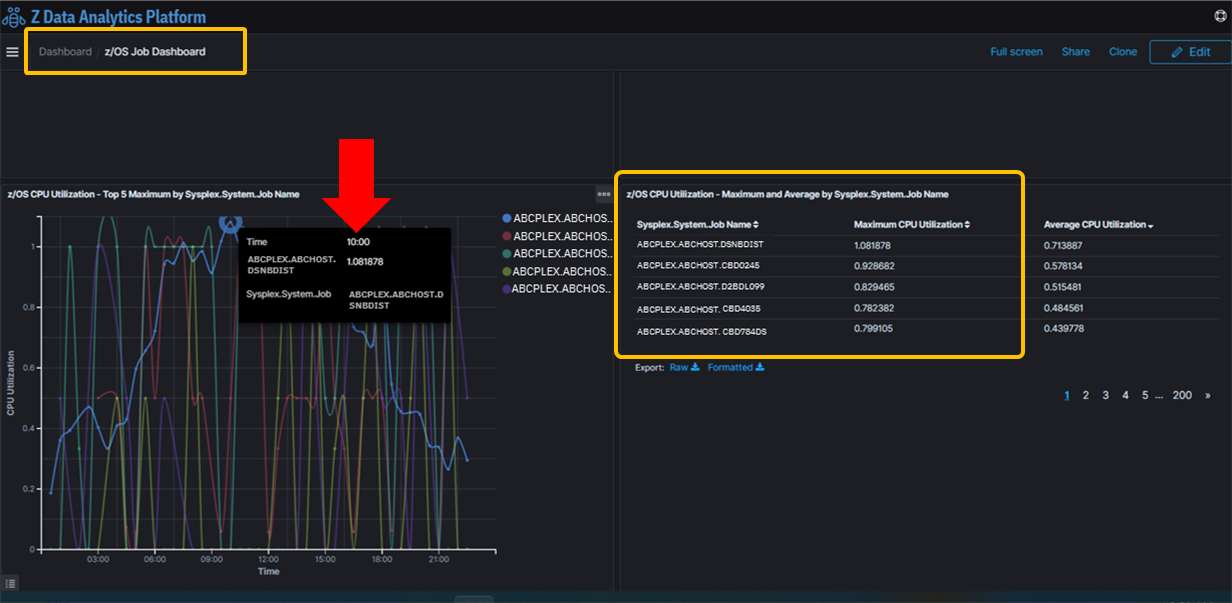
Figure 2: Db2 Distributed Address Space was ranked top1 CPU user, but DB2DBM1 and DB2MSTR were down below top 200 rank behind other hundreds of jobs.
SYSLOG content analysis – There are periodic warning messages about CPU and response times in CICS transactions running higher than predefined thresholds. During one notable problem period, CICS transaction dumps message count spiked much higher than normal.
Figure 3 from SYSLOG message contents, we used IBM Z Log Analytics and discovered high CPU warnings in pink color spikes between 11:30 - 14:30, and CICS dump request spike in green color between 13:00 - 13:30.
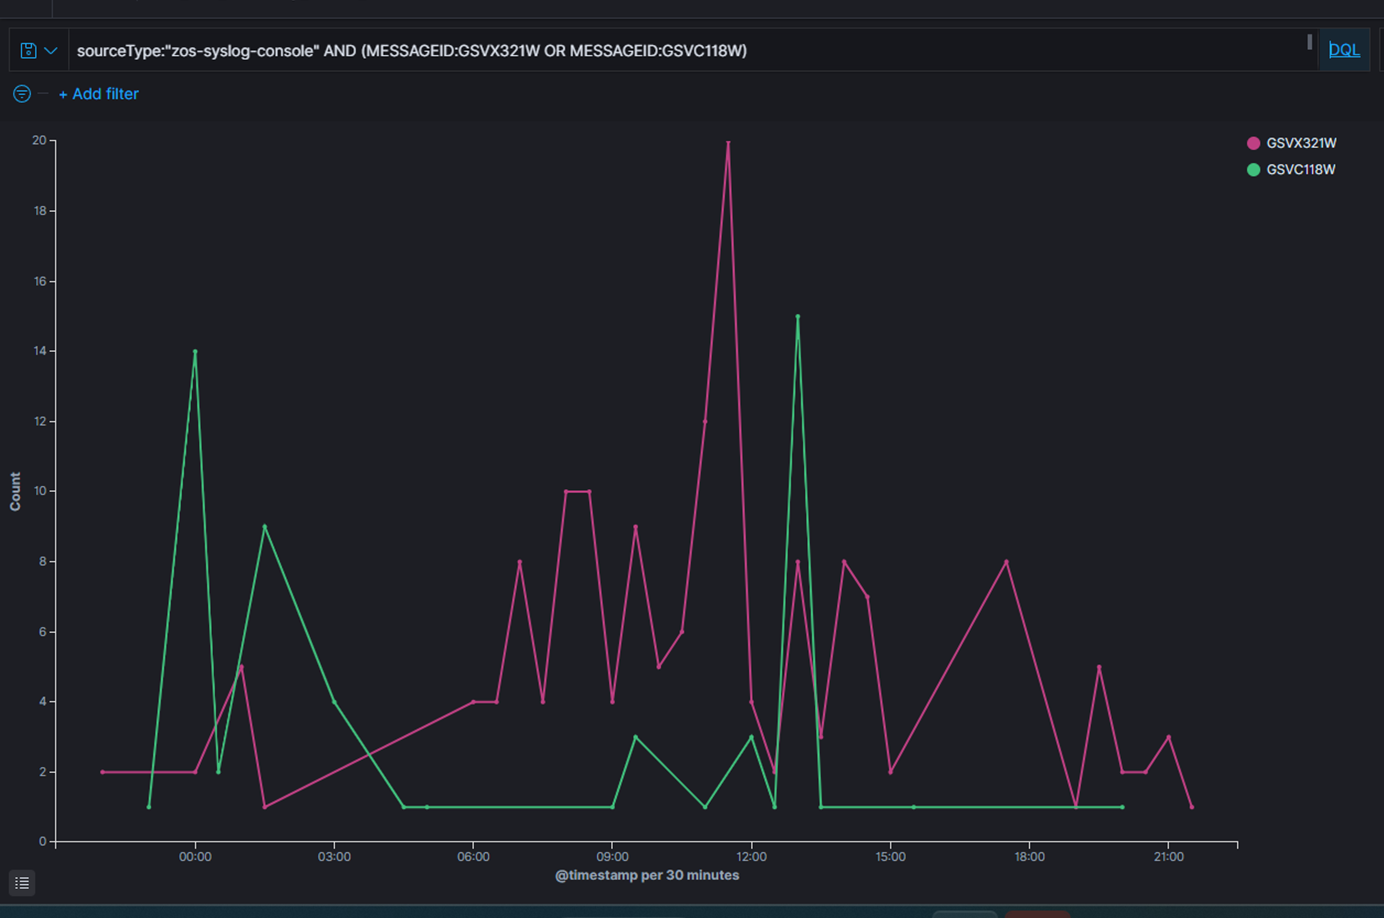
Figure 3: High CPU and High CICS Dump Requests trend from SYSLOG content analytics
Note that for this customer's rapid proof of concept case, we did not collect CICS metric data for the IBM Z Anomaly Analytics with Watson to show machine learning produced evidence. Otherwise, it is expected to see high anomalous scores in CICS KPI groups, in this case, the CICS "Dumps".
Action 2 / inferencing
This leads us back to the question, during the workload peak time range, why was DB2 suffering from those high latch suspensions? Did some ad-hoc FTP jobs get higher priority dominating the CPU utilization than DB2?
By design, DB2 internal latch requests are managed by in-memory services. In a normal good day, the requests come-in and go fast in transient, no high suspension counts are expected.
When CICS transaction dumps indicated high, we saw IZAA DB2 latch suspension anomaly score went high as well. This makes us curious whether CICS transaction dump requires higher CPU to handle the resource clean-up, would that demand compete against other concurrent DB2 CPU requests to process latch requests? How was the z/OS overall CPU capacity at that time? Was the CPU stressed or sub-capped?
Summary
This observation gives us the evidence needed to discuss the problem identification with the customer’s z/OS system administrator to validate how the z/OS Workload Manager (WLM) policy was defined for DB2, and the DB2 workload importance rank among FTP, CICS jobs, and other workload types under WLM. Additionally, we must review all the DB2 ZPARM configurations for buffer pool, EDM pool, and relevant parameters with the DB2 system administrator.
Results/Benefits
This client has been using OMEGAMON DB2 and Query Monitor on a routine basis. However, with IZAA machine learning scored results and IZLDA’s trend analysis, the observability is enhanced with a broader spectrum by including the automatic out-of-norm behavior evaluation, plus the relevant log content evidence to show the trends, with a simplified easy-to-read graphic dashboard.
With 360-degree views, the client can now speed up the problem identification process, reducing it from weeks down to hours or even minutes. The evidence from the analytics products can help communicate the observations to the proper subject matter experts just-in-time to avoid an outage. By consistently implement these monitoring practices, the system health can be maintained with automated lenses, enabling a proactive and preventative approach rather than a reactionary/firefighting mode.
Business outcome
By supplementing traditional monitoring solutions with AI/ML-powered solution like IBM Z Anomaly Analytics with Watson and IBM Z Operational Log and Data Analytics in real-time, you can expand your monitoring coverage without solely depending on subject matter experts to accelerate root cause identification and help achieve service level agreements for higher business efficiency results.
Would you like to comment or contribute your real-world use cases? Please click the “Like” icon if you like to see more AI/ML use case posts.
-----------------------------------------------
Footnotes:
IZAA – IBM Z Anomaly Analytics with Watson. You may learn more about this product at https://www.ibm.com/products/z-anomaly-analytics
IZAA latest release v5.1.0.8 blog link at https://ibm.biz/ZAA-new-release
IZLDA – IBM Z Operational Log and Data Analytics. Learn more about this product at http://ibm.biz/ZLogDataAnalyticsInfo
IZLDA latest release v5.1.0.8 blog link at https://ibm.biz/ZOLDA-new
EAP – Early Access Program
WLM – z/OS Workload Manager
KPI – Key Performance Indicator