At a time when teams in charge of Z systems need to:
- Do more with less
- Support the digitalization effort
- Support growing transactions volumes
Analytics on Z data help Z users and stakeholders with:
- Providing easy access to information (current and historical)
- Reducing the time to insight to accelerate troubleshooting
- Anticipating issues before they impact the system
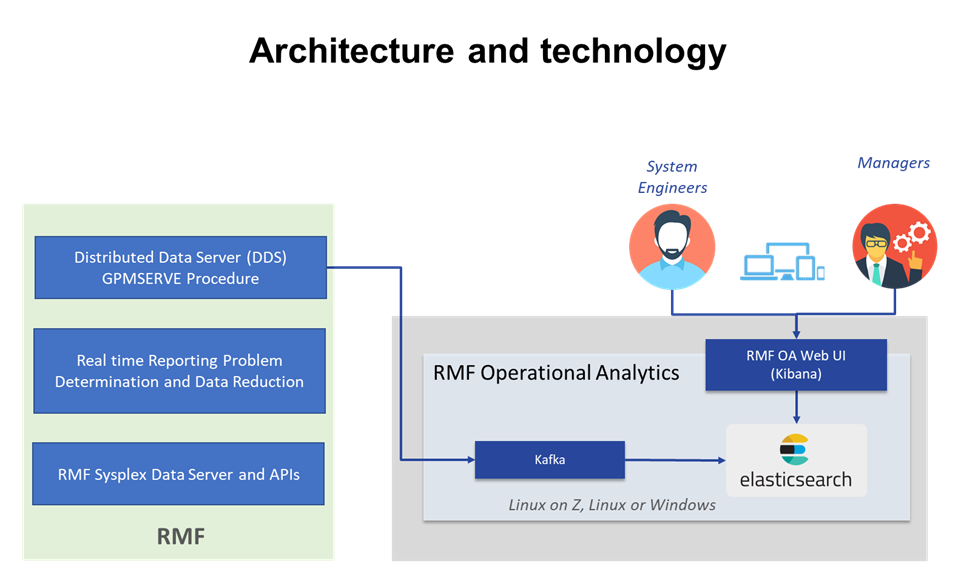
RMF Operational Analytics (which is part of IBM Z OMEGAMON Integration Monitor) provides you an early taste of analytics on Z data. The solution based on proven open-source technologies (Elasticsearch®, Apache KafkaTM, and KibanaTM) is easy to implement and has a low cost of ownership. It can run on Linux® on IBM Z, Windows®, Linux or in the Cloud. Thanks to the RMF Distributed Data Server (DDS) (also known as GPMSERVE) it provides near real-time access to RMF reports without requiring changes to the Z system.

Let’s look at some of the visualizations provided out of the box by RMF Operational Analytics.
CPU consumption monitoring vs Capping
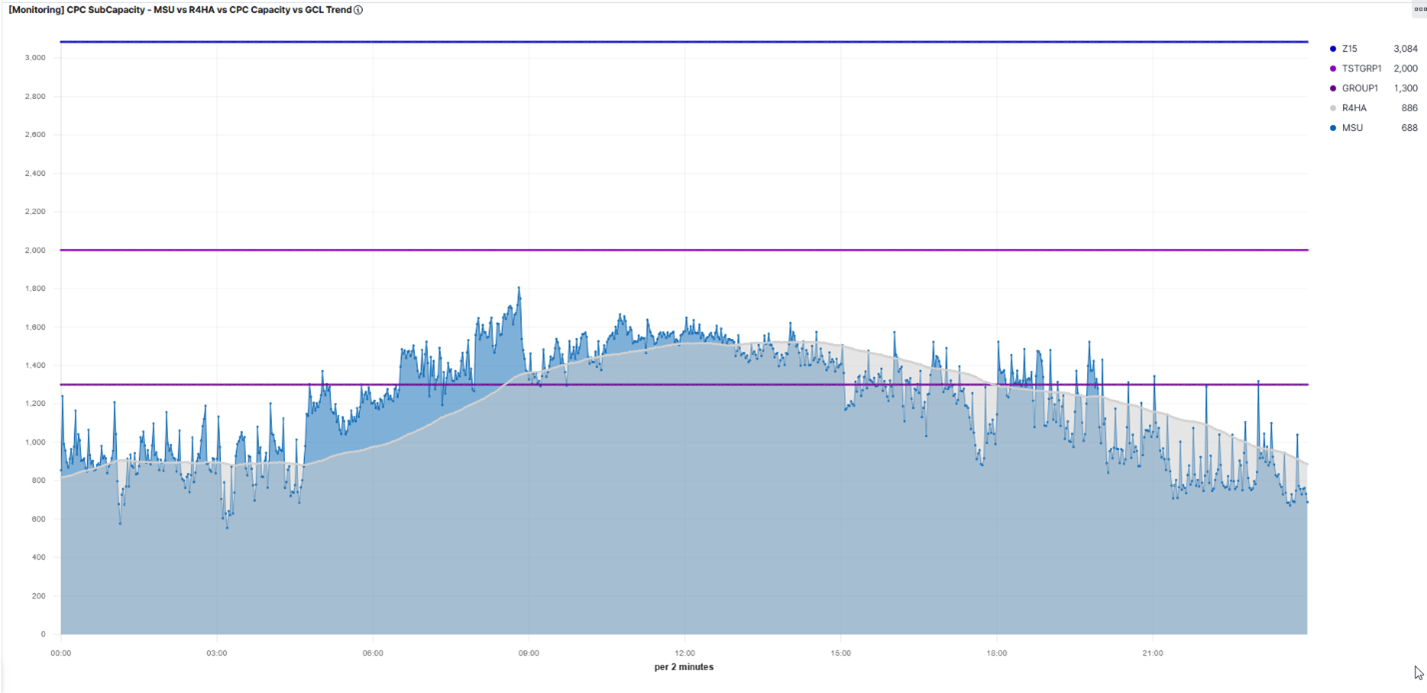
This visualization provides you insight into the activity of the whole system by confronting MSU, Rolling 4-Hour Average (R4HA), Group Capacity Limit (GCL), and Central Processor Complex (CPC) Capacity. Here are some possible use cases:
- By confronting the sum of R4HA of a Group Capacity to the GCL, we can monitor and anticipate a possible future capping issue.
- By confronting the sum of MSU with the CPC Capacity, we can see if the Mainframe is correctly sized for the activity during peak activity.
- By leveraging elastic search capability on long-term historical data, we can provide trend analysis.

Capping ratio and remaining time until capping
- The first visualization shows for each LPAR, the percentage of capping for the period displayed.
- The second visualization provides the amount of time before capping as estimated by RMF.


Total Request rate by Coupling Facility (CF) Structure
This visualization allows the user have insights into the Sysplex activity. The user can identify when the Coupling Facility is most used and by which Cross-System Coupling (XCF) structure in case there is a Sysplex performance issue.

Summary
RMF Operational Analytics is an easy to implement a solution that provides near real-time access to RMF reports without requiring changes to Z systems. With several out-of-the-box visualizations, it helps easy access to historical information for trend analysis and comparison, reduced time to insight to prevent issues, and accelerates troubleshooting, and detection of issues before they impact the system. You can find information on the IBM Z Monitoring Suite that includes RMF Operational Analytics on the product page, and the Knowledge Center.
IBM Z OS IBM Z OMEGAMON Software AIOps on Z