z/OS Debugger v14.2.3 enables support for collecting code coverage using debug profiles. For this feature, you will need the
v14.2.3 client and host PTF, and you will also need to have a system configured with the
Debug Profile Service.
Adding the simple TEST runtime option
To begin with, I have some JCL that includes three steps:
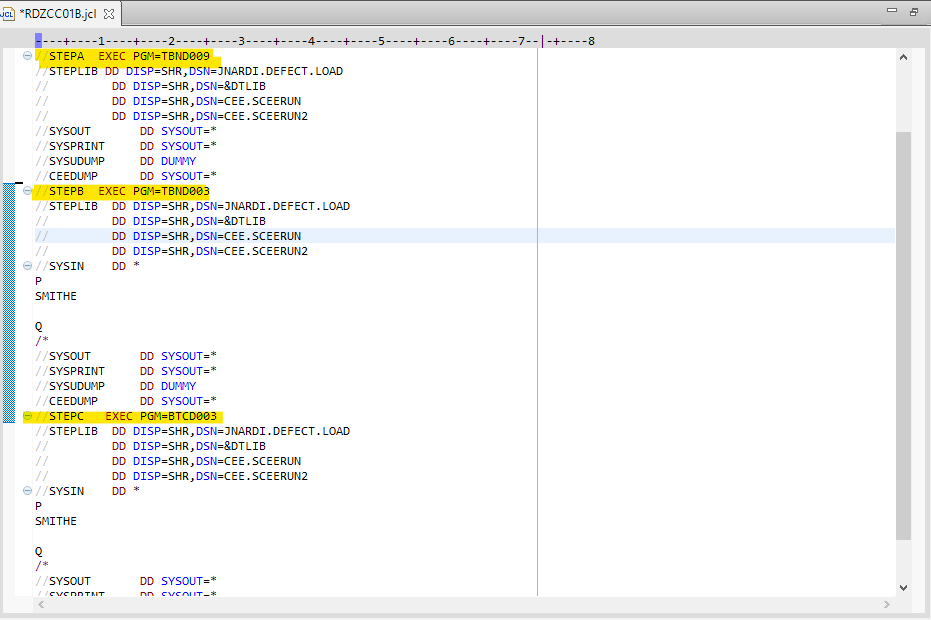
JCL with three steps
When I use a profile to trigger z/OS Debugger, I don't need to worry about a
complicated TEST runtime option, I can use the
simple TEST runtime option:
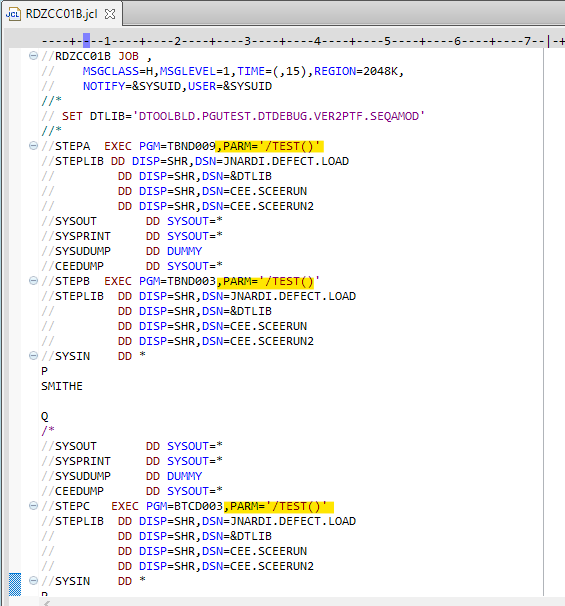
JCL after inserting the simple TEST runtime option
What I like about the simple TEST runtime option is that now I never need to modify my JCL again. If there is a non-CICS debug profile active, that is what will trigger z/OS Debugger. If no debug profile is active, the debugger is not triggered, and my JCL runs as it would normally. I won't need to ever edit my JCL to change my IP address, like when I use TCPIP with the TEST runtime option and I won't need to update the JCL to switch between debug and code coverage.
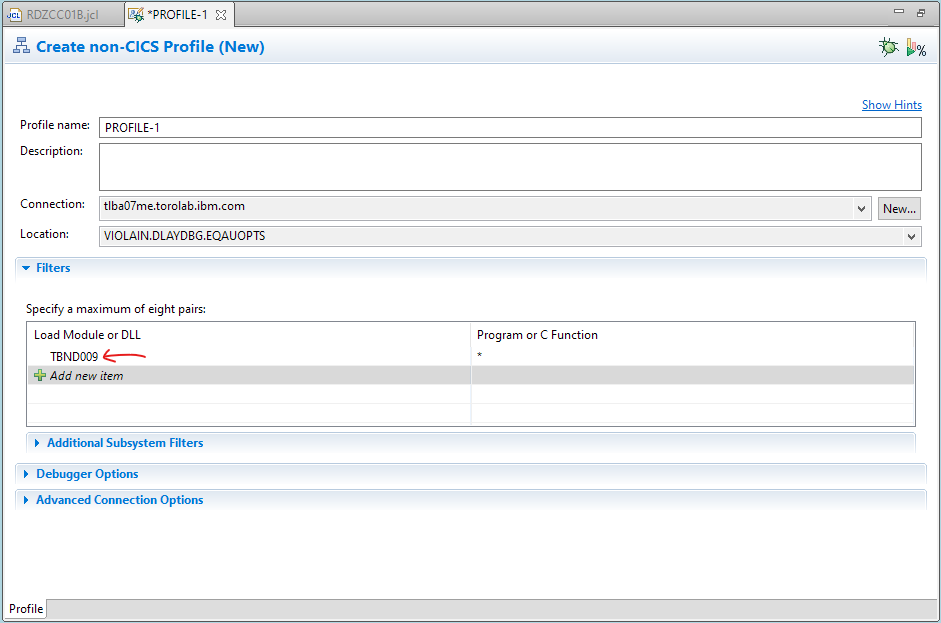
Creating the non-CICS profile
Now that I have updated the JCL, all I need to do is to create a non-CICS profile that describes when my code coverage session should start.
-
- First I click on the Create non-CICS profile button in the z/OS Debugger Profiles view:
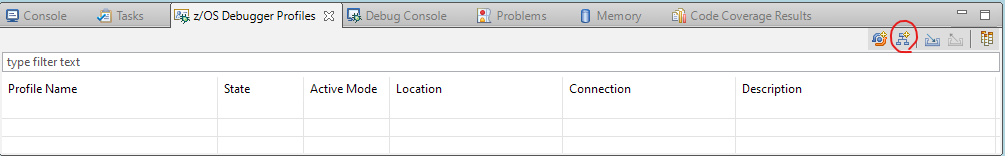
The Debug Profile Editor is then opened.
- Since this is a non-CICS profile, I need to specify at least one module to trigger the debugger. In this example, even though my JCL contains multiple steps, I only want the debugger to produce code coverage for TBND009 (ie the first step), so I add that to the profile:
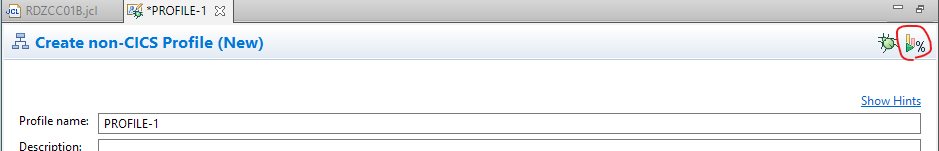
Activating for code coverage
I have specified the needed values in my profile, so all I need to do is click on the Save and Activate for Code Coverage button:
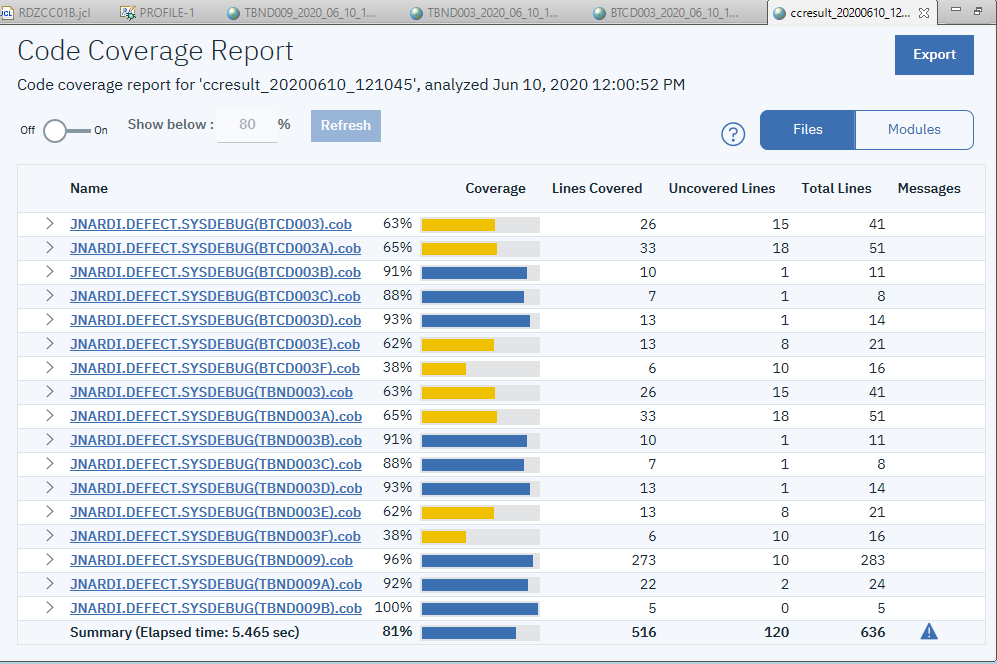
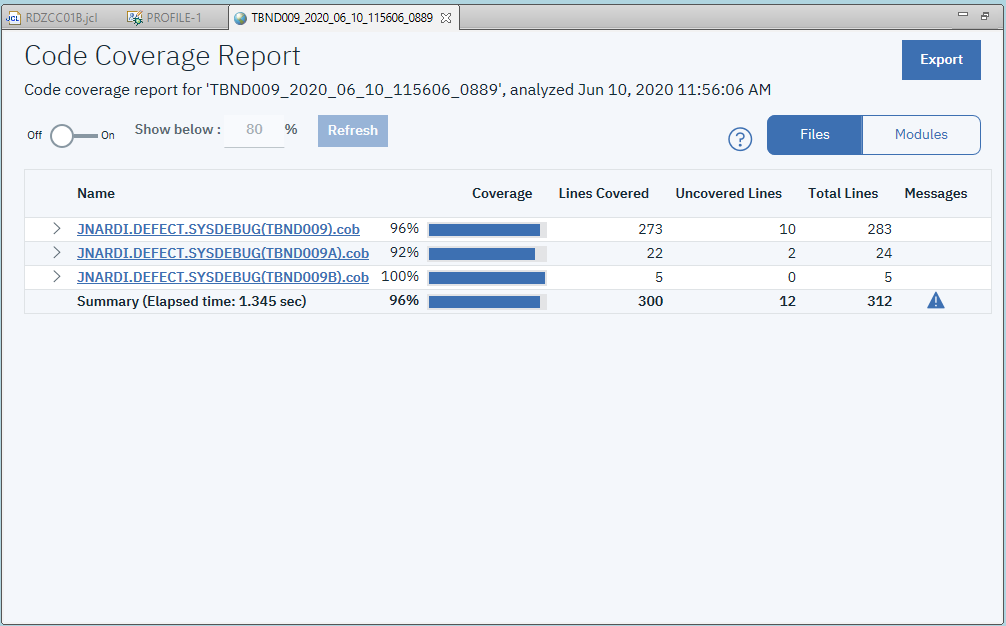
Now I can submit my JCL and wait for the result. When the module I specified in my profile is detected by z/OS Debugger, the code coverage session starts, and the result appears in the Code Coverage Results view:
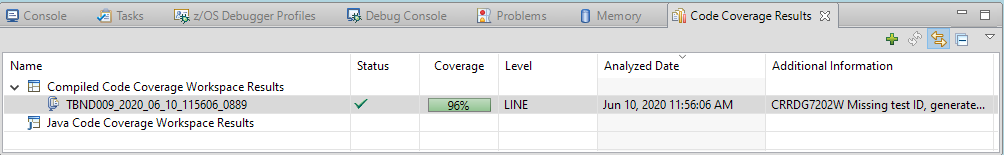
and is automatically opened in the code coverage results viewer:
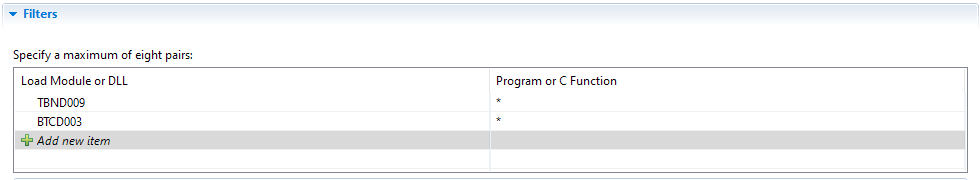
Specifying multiple modules
In my JCL, only STEPA invoked the module TBND009. Suppose I wanted to collect code coverage for more than one module, say BTCD003 from STEPC as well. All I need to do, is to add that module to the list in my profile, and click on the Save and Activate for Code Coverage button:
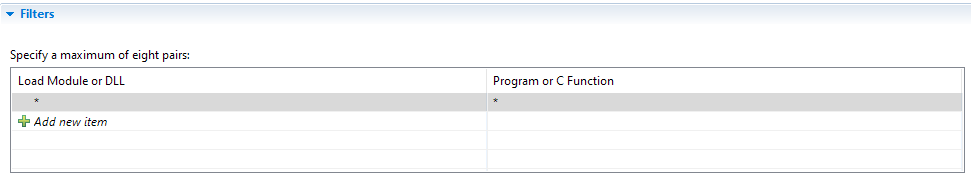
But to make it even more interesting, let's try to collect code coverage for all the steps in my JCL. The easiest way to do this would be to use the * wildcard:
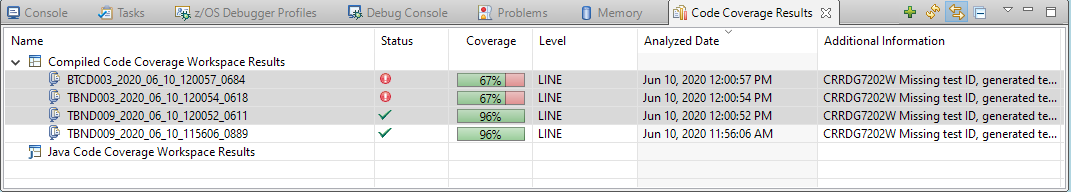
I click on Save and Activate for Code Coverage, and wait for the results. Since each step triggers z/OS Debugger separately, I end up with three code coverage results:
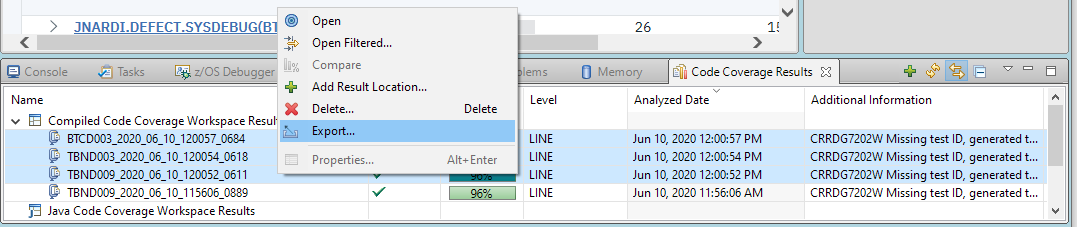
Merging code coverage results
I have decided that I want one result instead of three, and to do that I will merge the results from the Code Coverage Results view. I select the three results, right-click for the context menu and select Export:
I leave the default settings, and ensure that for Add location to Code Coverage Results view is checked:
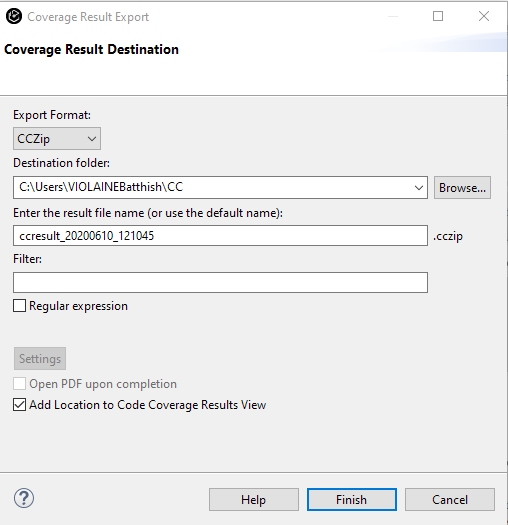
I click on Finish, the new location is added to the view, and I can see the merged result:
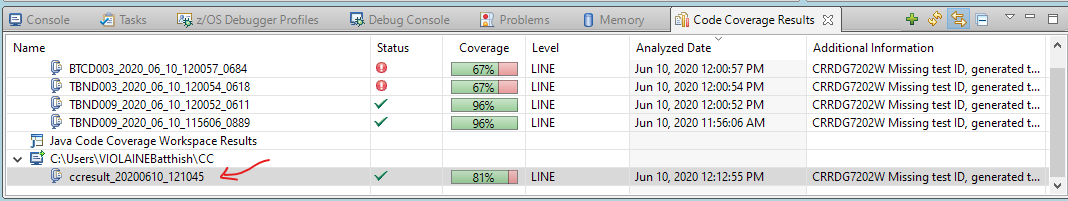
Double-clicking opens the result, and I can now see the merged results in the result viewer: