Introduced in z/OSMF V2R3, September, 2017, the z/OSMF Sysplex Management task allows you to view sysplex resources, and the functions are also available in z/OSMF V2R2 since June, 2018.
You can view sysplexes, and systems in a sysplex. You also can view physical configurations, such as coupling facilities and LPARs, and logical resources, such as couple data sets and coupling facility structures.
Graphical views help you to visualize the topology of your sysplex. From the graphical view, you can drill down for more information. Many of the pages in the Sysplex Management task include a graphic view and a table view. You can drag the divider that separates the views to expand or reduce each section. The graphic view is in the upper portion of the window. Sysplex objects, such as CPCs and coupling facilities, are shown in graphic form. Right-click a link inside an object (typically the name of the object) to display a menu of actions that are available for the object.
First, we expand the Sysplex category in the navigation area. Then, we select Sysplex Management, as shown in Figure 1.
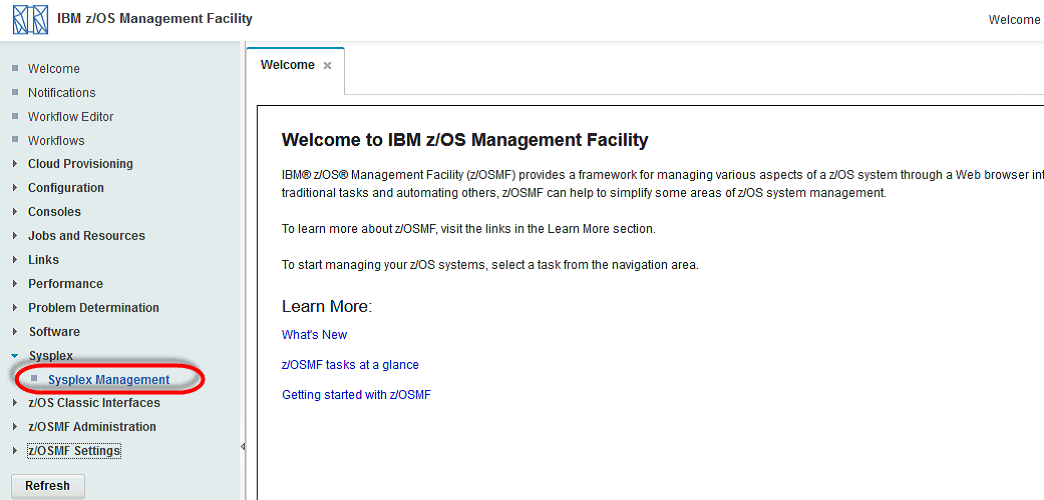
Figure 1 Sysplex Management plug-in
The topology of the defined sysplex in a graphic and a table view is shown in the first window
(see Figure 2). You can view multiple sysplexes which were defined in z/OSMF Administration -> Systems task. From the main page, you can see a more detailed view of the sysplex definitions.
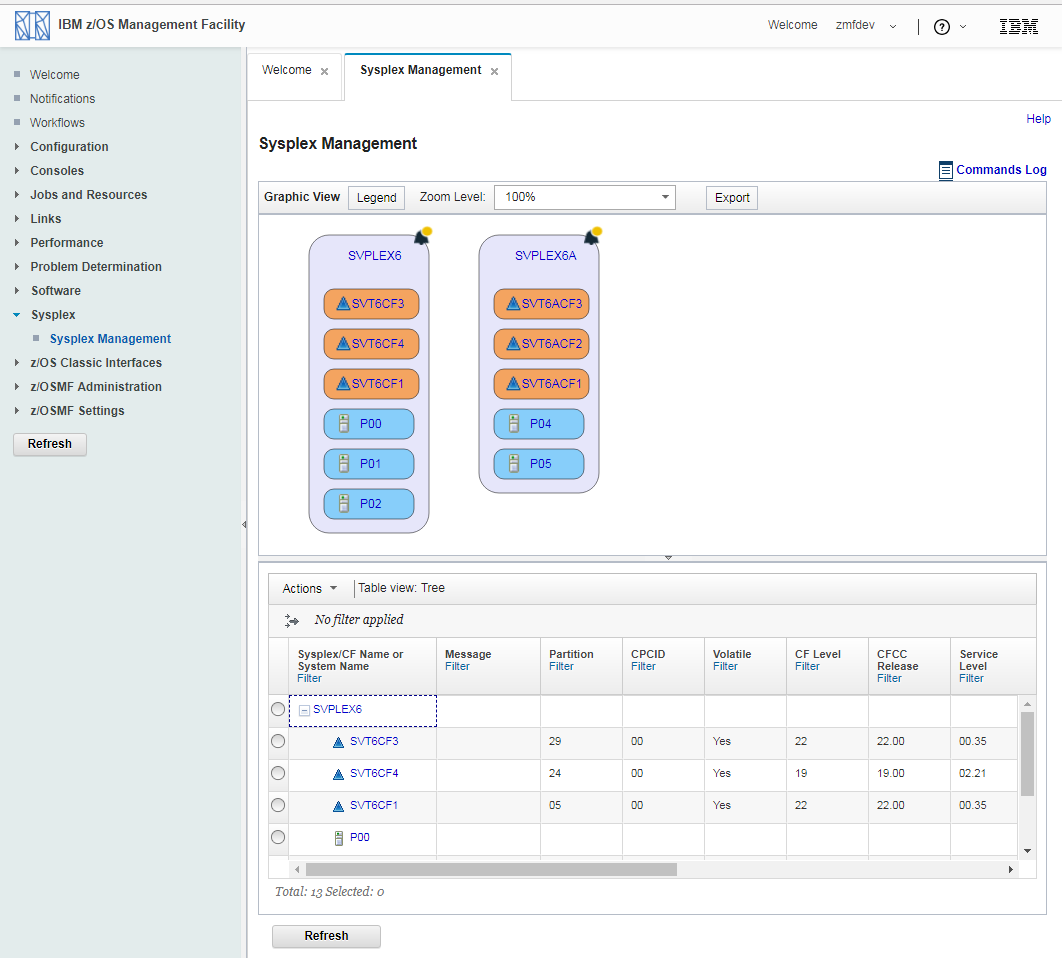
Figure 2 Sysplex Management main page
Use the Zoom Level option to zoom in on or out of the graphic. From a drop-down list, you can
select a predefined zoom level. This value can also be overwritten with your own zoom level,
as shown in Figure 3.
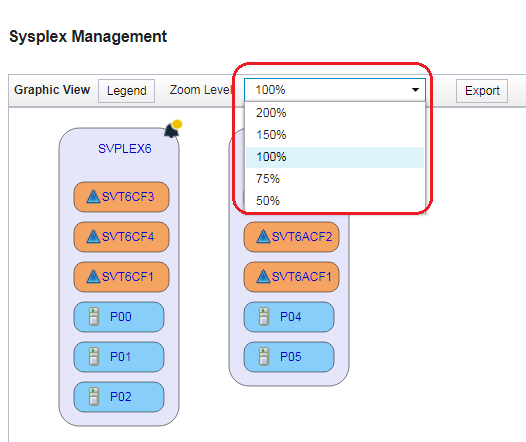
Figure 3 Choosing a Zoom Level
Use the Highlighter feature to define colors for the objects that are displayed in that view. An
example of changing the color of the sysplex is shown in Figure 4. You can reset all of your
changes immediately by clicking Restore Defaults.
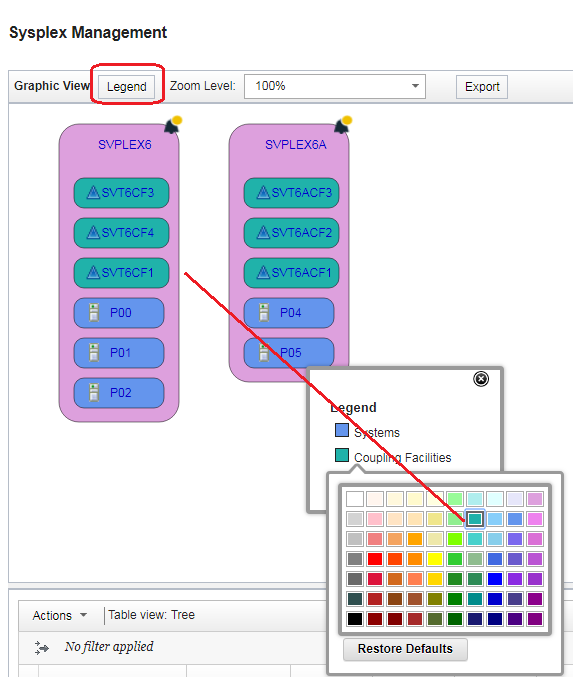
Figure 4 Change Highlighter of Graphic View
Use the Export feature to save the graphic view as a scalable vector graphics (.svg) file.
Icons in the graphic view typically appear before an object to indicate its type (such as the CF
icon for coupling facility), which are not included in the .svg file. The exported .svg file might
not be well-formatted if the length of the text is too long.
An example of the Export function is shown in Figure 5.
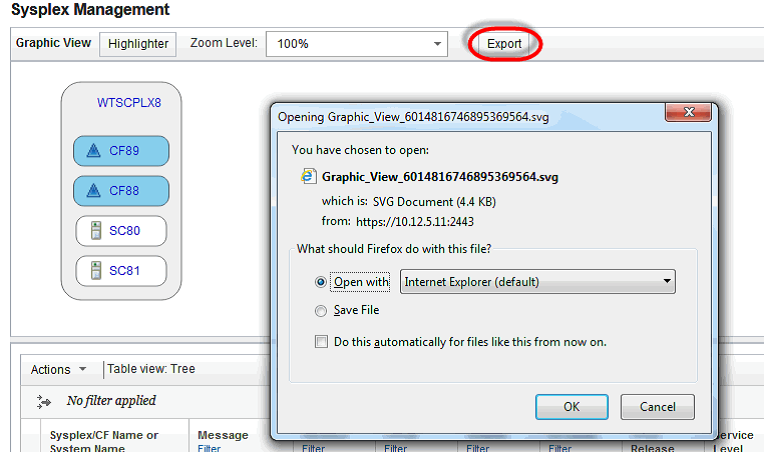
Figure 5 Export Graphic View
Right-click the sysplex name (as shown in Figure 6) to open a selection of other views.
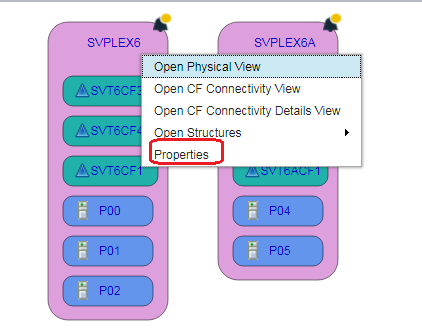
Figure 6 Options for View
Click View Properties to see a more detailed view, as shown in Figure 7.
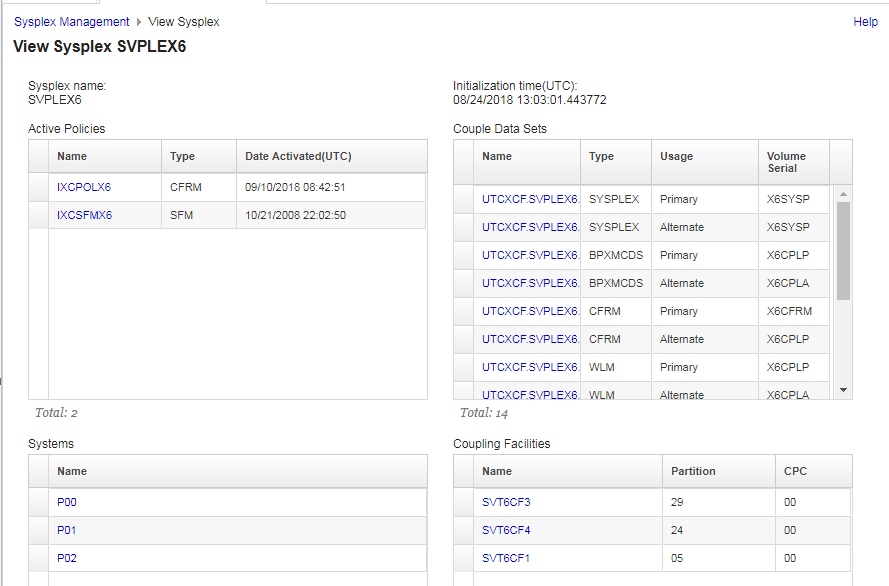
Figure 6
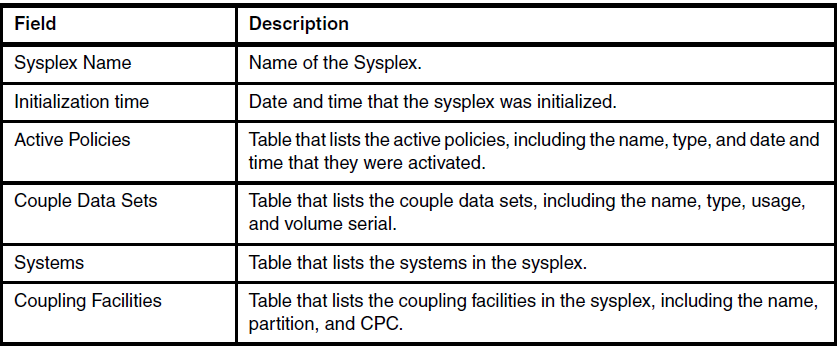
The fields that are available in the detailed view are listed in Table 1.
Table 1 Descriptions on the View Sysplex window
To see more information about the couple data sets, we click the UTCXCF.SVPLEX6.FCTVERFY.COUPLE.FOUR link in our
example. The properties of the Sysplex couple data set (CDS) is shown in Figure 8. You
can click every CDS to see more information.
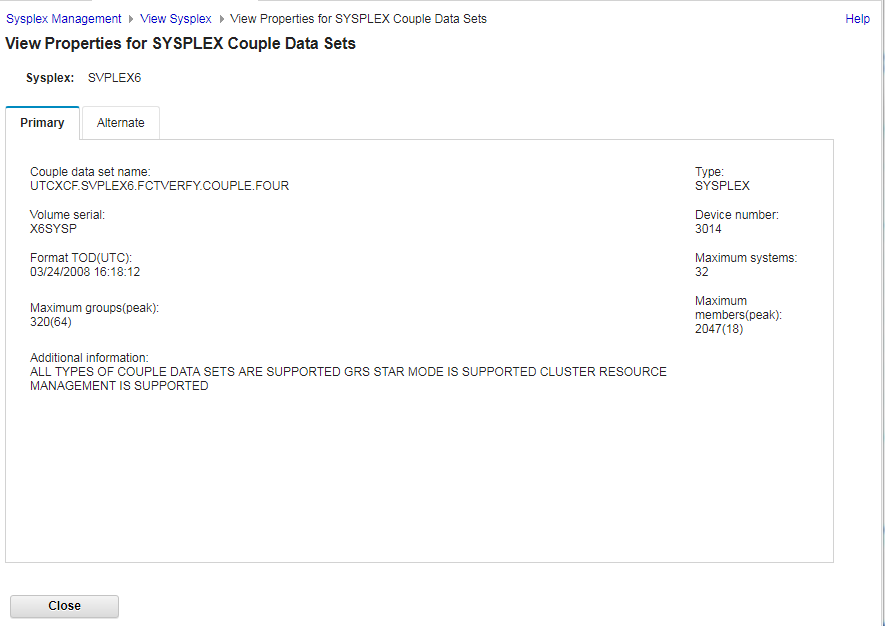
Figure 8 Properties Sysplex Couple Data Set
Return to the main page and select Open to see a physical view of the sysplex. As shown in
Figure 9, the physical view of this sysplex is presented in a graphic view. The couple data
set information also is shown in this graphical view.
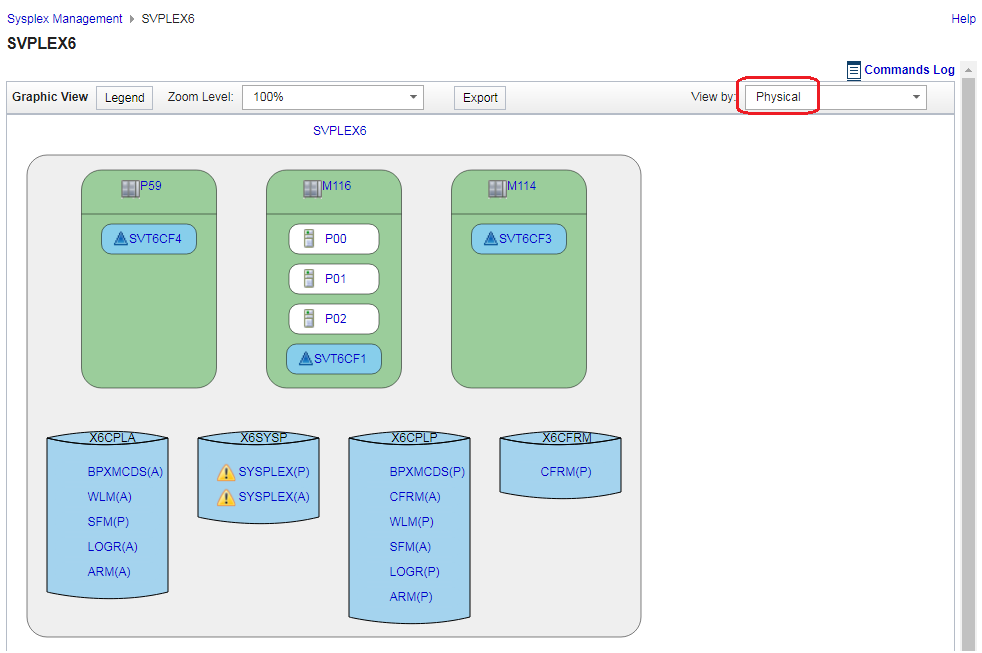
Figure 9 Physical View of Sysplex upper part
Below the graphic view you can see the table view. By default, you see the CDS information.
You can select between CDS and CPC information. An example of the CDS view is shown in
Figure 10. The view easily can be changed by using a drop-down menu.
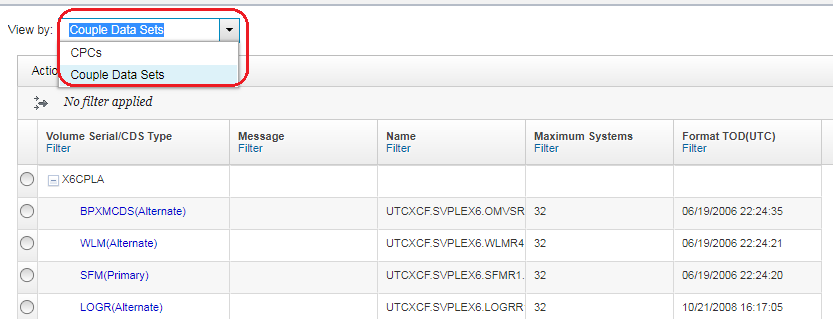
Figure 10 Table View Couple Data Sets of Sysplex
The physical view can be changed to see more information about the coupling facility (CF).
You can change the View in the upper right corner, as shown in Figure 11.
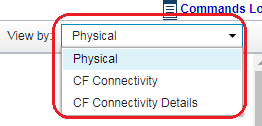
Figure 11 Graphic View options
The CF Connectivity Details view of the sysplex are shown in Figure 12. In the table at the bottom of the window, you see more information about the CF connections, such as CHPID,
Adapter, Port, Type, and CF Name.
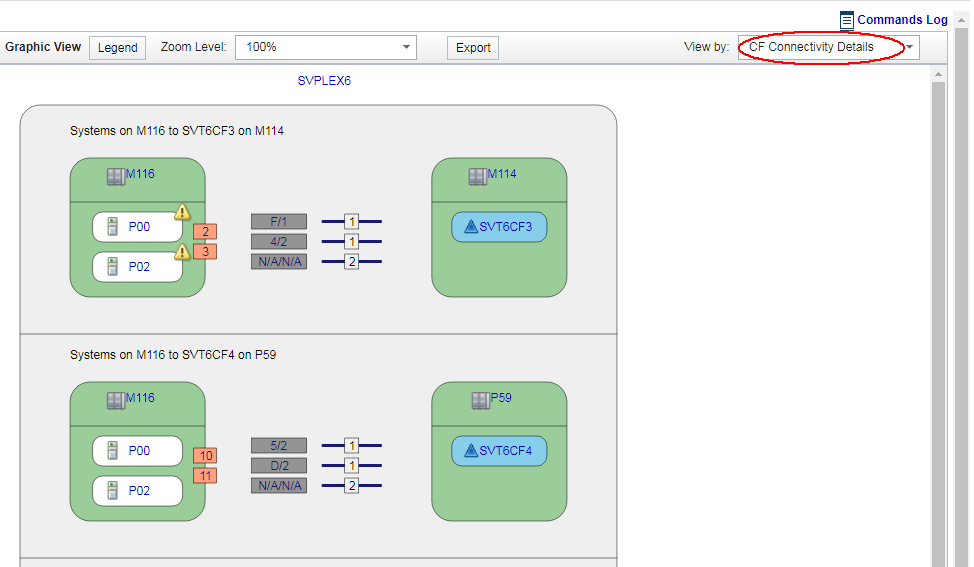
Figure 12 CF Connectivity Details View
The Coupling Facility Structures view of the sysplex are shown in Figure 13. In the table at the
bottom of the window, you see more information about the CF structures, such as Type, Status,
and allocation time. You can also view properties of a CF as shown in Figure 14.
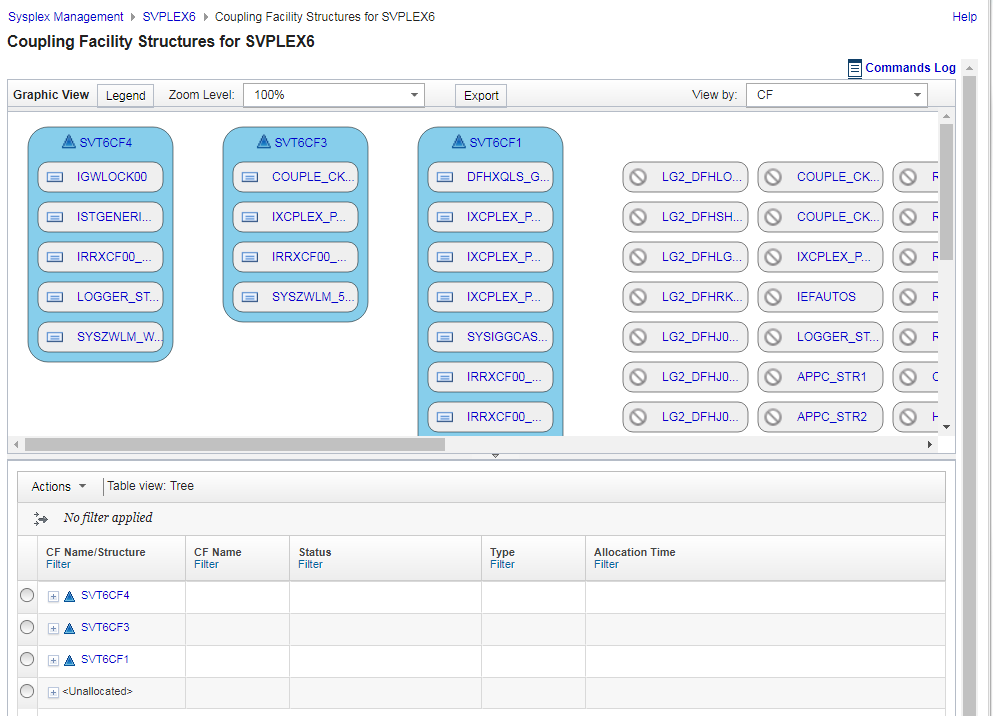
Figure 13 Coupling Facility Structures View
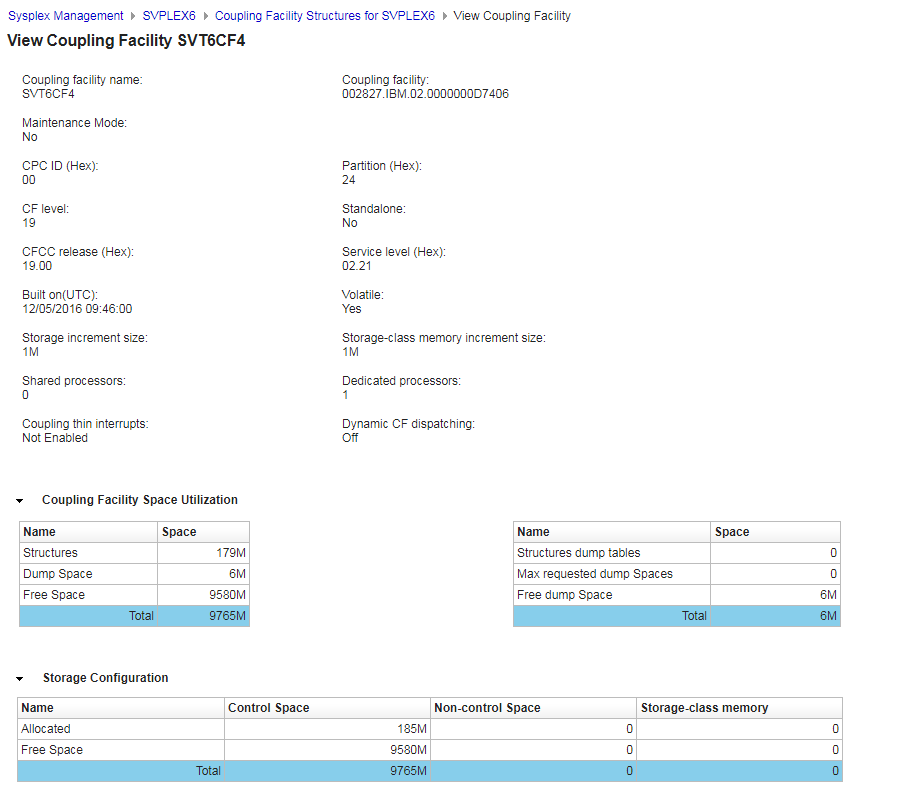
Figure 14 View Coupling Facility Properties
Besides above functions, z/OSMF Sysplex Management V2R3 is enhanced in September, 2018 to allows you to modify sysplex resources, such as rebuild or duplex CF structures, configure or vary channel path, switch an alternate couple data set to primary, set CF maintenance mode, etc. Join me in my next blog.
References:
1. z/OSMF Marketplace:
https://www.ibm.com/us-en/marketplace/zos-management-facility
2. z/OSMF Trial:
https://www.ibm.com/account/reg/us-en/signup?formid=urx-34578
3. z/OSMF One Stop Hub:
https://www.ibm.com/developerworks/community/blogs/e0c474f8-3aad-4f01-8bca-f2c12b576ac9/entry/z_OSMF_One_Stop_Hub?lang=en
4. z/OSMF Knowledge Center:
https://www.ibm.com/support/knowledgecenter/en/SSLTBW_2.3.0/com.ibm.zos.v2r3.izu/izu.htm