Hi
@Jason SiztoIn a Case discussion with IBM Db2 support regarding this..
TS008647857 They suggested to use other set of metrics to track workload async requests..
Different agents in different service classes or workloads could request same data page be prefetched. Prefetcher would load page once and this page could be used by multiple workloads/service classes. And for page cleaners; similar thing; 2 or more workload could touch/modify a page. Due to this, the decision was made to not track it workload/service class level.
Note that for prefetching there are metrics in mon_get_workload (e.g. pool_queued_async_data_pages/requests) that are counted; tracking pages requested; so you can tell at a workload level (also service class) which workload is driving the prefetching.
So, I would suggest to add a new graphic for summing up these pool_queued_async_*_reqs, , so we can have a better idea , how the workload is contributing to the overall IO (physical reads/writes ).
This would be a nice addition.. Maybe we can plot both lines into the same graphic , using different colors.. Just an idea.. but for sure, these set of metrics should be added there.
And , regarding the previous suggestion, to add a new option to see the entire DB, if that happens, the async IOS will be already counted in the physical reads/writes.. so in that case, we won't have this new metric.
Thanks
------------------------------
Samuel Pizarro
Db2 DBA
Kyndryl
Brazil / Sumaré - SP
------------------------------
Original Message:
Sent: Mon March 14, 2022 03:27 PM
From: Samuel Pizarro
Subject: DMC - Physical Reads metrics discrepancy between Database / Bufferpools level
Hi @Jason Sizto
For DMC, we understand the Database page is the high level page for users to first eyeball and identify problems. We will look into your suggestion on how we can distinguish mon_get_database and mon_get_workload discrepancies and how to make the representation clearer.
Yeah, maybe in the right-upper corner combo, to select the workloads,, have a new option to grab metrics from mon_ge_database instead.. "Entire Database" , or something like that.
And.. as we now know, that metrics from workloads does not have assync IOs , we should add a new plot just for that metric, beyond physical IO.
The the I/O pages, the metrics are good.
Only thing that I noticed, is that for Prefetchers tab, the option to look back is blocked.. just realtime values are available..
Regards
------------------------------
Samuel Pizarro
Db2 DBA
Kyndryl
Brazil / Sumaré - SP
Original Message:
Sent: Sat March 12, 2022 02:04 PM
From: Jason Sizto
Subject: DMC - Physical Reads metrics discrepancy between Database / Bufferpools level
Hi @Samuel Pizarro
Regarding how mon_get_database and mon_get_workload bufferpool metrics difference in Db2, it is likely due to how the metrics is being accounted for with db2 agents vs page cleaner, prefetcher agents etc. I agree, it is not intuitive for DMC Database page to use workload data.
For DMC, we understand the Database page is the high level page for users to first eyeball and identify problems. We will look into your suggestion on how we can distinguish mon_get_database and mon_get_workload discrepancies and how to make the representation clearer. Thank you for your suggestion.
I see you are already looking at the monitor > I/O > bufferpool and prefetcher pages for I/O metrics. These are the pages where you find further breakdown of async I/O, page cleaner and prefetcher stats. Let us know if I/O pages have information you are looking for.
------------------------------
Kind Regards,
Jason Sizto
Original Message:
Sent: Fri March 11, 2022 02:48 PM
From: Samuel Pizarro
Subject: DMC - Physical Reads metrics discrepancy between Database / Bufferpools level
Hi @Jason Sizto
Oh my God.. I can't believe that.. That is really , really a bad thing ! I would prefer to hear that it was bugged then hearing something like this.
This means that Db2 dev team deliberately removed the prefetching (async IOs) metrics from workload/management classes level ? If we have an IO intensive system, where the db is performing too much IO we can't use the Workload/service-classe monitoring metrics to determine which of them are performing too much IO in a consistent manner..
This lack of consistence between the SAME metrics, should be better documented.. In fact it should never exist at 1sr place.. I can't see a reason why physical_reads would account asynch metrics in one dimension, but not in others.. this makes troubleshooting even harder than what is already is..
Anyway... this is not a DMC problem.. But it seems that DMC team was not aware of that GAP as well.
Based on this.. I believe when we choose "All workloads" in this page, DMC should pull metrics from mon_get_database instead, in order to provide better and consistent metrics.. Or , add a new option like "Entire Database" or something like that.
Regards
------------------------------
Samuel Pizarro
Db2 DBA
Kyndryl
Brazil / Sumaré - SP
Original Message:
Sent: Thu March 10, 2022 02:57 PM
From: Jason Sizto
Subject: DMC - Physical Reads metrics discrepancy between Database / Bufferpools level
Hi @Samuel Pizarro
I checked with Db2 team and for the metrics you are looking related to bufferpool read and write metrics.
There are differences between how they are collected from MON_GET_DATABASE and MON_GET_WORKLOAD. For MON_GET_DATABASE, it includes metrics from asynchronous read and write operations, e.g. from page cleaners and prefetchers. And for MON_GET_WORKLOAD, it only includes metrics from fore ground agents. See more in https://www.ibm.com/docs/en/db2/11.5?topic=elements-time-spent-monitor-element-hierarchy for asynchronous metrics for MON_GET_DATABASE.
------------------------------
Jason Sizto
Original Message:
Sent: Mon March 07, 2022 11:26 AM
From: Samuel Pizarro
Subject: DMC - Physical Reads metrics discrepancy between Database / Bufferpools level
Hi @Jason Sizto
Thanks for that info. It helped a lot to determine the gap.
It seems mon_get_workload() table function is not working properly. if you sum all workloads from mon_get_workload, it does not match metrics for the entire db reported by mon_get_database(). Even making deltas.
I have attached two files. Chek out values captured from both table functions in same interval. The values from mon_get_workload matches what is saved in reposotiry IBMCONSOLE.WORKLOAD, but unfortunatelly, the values aere not reflecting the overall database reality.
Can you engage Db2 support internally for this ?
Thanks
------------------------------
Samuel Pizarro
Db2 DBA
Kyndryl
Brazil / Sumaré - SP
Original Message:
Sent: Fri March 04, 2022 08:10 PM
From: Jason Sizto
Subject: DMC - Physical Reads metrics discrepancy between Database / Bufferpools level
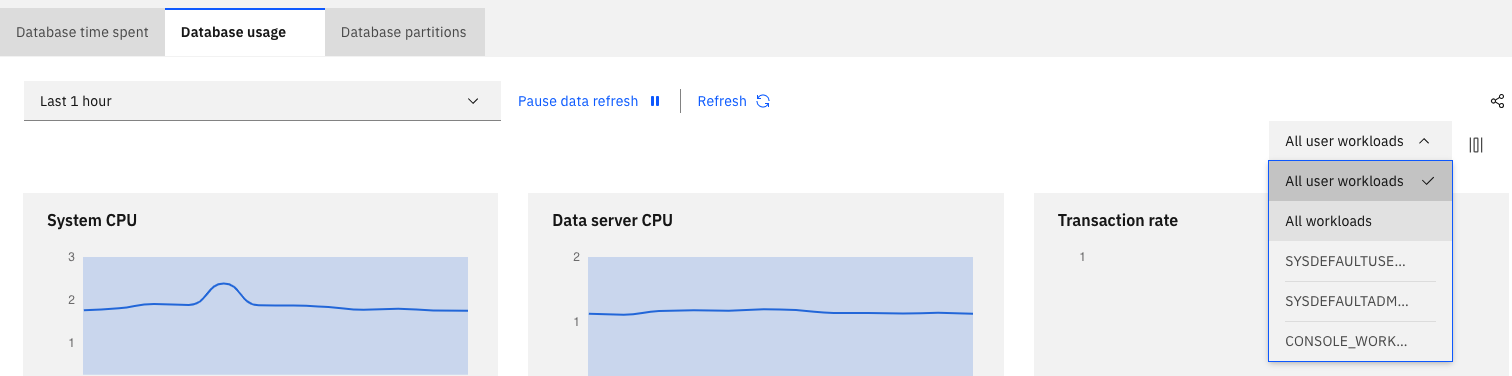
Hello Samuel,
The Database Usage page gets the data by calling mon_get_workload function and data is stored in IBMCONSOLE.WORKLOAD table. The charts for "All user workload" and "All workloads" is differed by data coming from CONSOLE_WORKLOAD.
Console collects data every 5 mins by default. You can compare the data in IBMCONSOLE.WORKLOAD and the data you collected by MON_GET_DATABASE and see if there are discrepancies.
------------------------------
Jason Sizto
Original Message:
Sent: Tue February 22, 2022 11:28 AM
From: Samuel Pizarro
Subject: DMC - Physical Reads metrics discrepancy between Database / Bufferpools level
Sorry @Zhen Ling Yu
But that is not the case.. Do you really believe that the console (DMC monitoring workload) would be contributing with this huge GAP ?
DMC workload is negligible compared with the user workload here.
The metrics between 'All user workloads' and 'All Workloads" filters are pretty much the same.
User workload: peak of 105,000/min
All workloads: same graph, and same values:
And again, if I take manual queries from mon_Get_database() table function, in the same interval , physical reads goes up to 1,300 Millions/min
------------------------------
Samuel Pizarro
Db2 DBA
Kyndryl
Brazil / Sumaré - SP
Original Message:
Sent: Tue February 15, 2022 12:32 AM
From: Zhen Ling Yu
Subject: DMC - Physical Reads metrics discrepancy between Database / Bufferpools level
Hi, Samuel, The default value of workloads does not contain CONSOLE's for Monitor, Database, Database usage page. If you want to check whole database, please switch from 'All user workloads' to 'All workloads' on the right side of page.
------------------------------
Zhen Ling Yu
Original Message:
Sent: Tue November 02, 2021 08:35 PM
From: Samuel Pizarro
Subject: DMC - Physical Reads metrics discrepancy between Database / Bufferpools level
The problem seems to be at DMC graph metric for db-level.
I have taken regular captures using MON__GET_DATABASE() table function and the values matches with the BP metrics.
| Time |
Physical Reads |
Delta time |
Delta Phys Reads |
Phys Reads/s |
Phys Reads/min |
| 2021-11-02-16.49.31.956000 |
97778141163 |
|
|
|
|
| 2021-11-02-16.50.05.515000 |
97778394170 |
00:00:34 |
253007 |
7.441 |
446.483 |
| 2021-11-02-16.50.58.266000 |
97779829437 |
00:00:53 |
1435267 |
27.081 |
1.624.831 |
| 2021-11-02-16.51.15.383000 |
97780214039 |
00:00:17 |
384602 |
22.624 |
1.357.419 |
| 2021-11-02-16.51.41.878000 |
97780541235 |
00:00:26 |
327196 |
12.584 |
755.068 |
| 2021-11-02-16.52.04.635000 |
97781105454 |
00:00:23 |
564219 |
24.531 |
1.471.876 |
| 2021-11-02-16.52.30.769000 |
97781597971 |
00:00:26 |
492517 |
18.943 |
1.136.578 |
| 2021-11-02-16.52.46.750000 |
97781638103 |
00:00:16 |
40132 |
2.508 |
50.495 |
| 2021-11-02-16.53.10.228000 |
97781658940 |
00:00:24 |
20837 |
868 |
52.093 |
| 2021-11-02-16.53.25.714000 |
97781759275 |
00:00:15 |
100335 |
6.689 |
401.340 |
| 2021-11-02-16.53.42.381000 |
97782173913 |
00:00:17 |
414638 |
24.390 |
1.463.428 |
| 2021-11-02-16.53.56.961000 |
97782549313 |
00:00:14 |
375400 |
26.814 |
1.608.857 |
| 2021-11-02-16.54.11.159000 |
97782901073 |
00:00:15 |
351760 |
23.451 |
1.407.040 |
| 2021-11-02-16.54.26.416000 |
97783279778 |
00:00:15 |
378705 |
25.247 |
1.514.820 |
| 2021-11-02-16.54.40.803000 |
97783627012 |
00:00:14 |
347234 |
24.802 |
1.488.146 |
| 2021-11-02-16.55.01.092000 |
97784130825 |
00:00:21 |
503813 |
23.991 |
1.439.466 |
| 2021-11-02-16.55.22.196000 |
97784659885 |
00:00:21 |
529060 |
25.193 |
1.511.600 |
| 2021-11-02-16.55.41.034000 |
97784711088 |
00:00:19 |
51203 |
2.695 |
161.694 |
| 2021-11-02-16.55.57.545000 |
97784951228 |
00:00:16 |
240140 |
15.009 |
900.525 |
| 2021-11-02-16.56.14.615000 |
97784984262 |
00:00:17 |
33034 |
1.943 |
16.591 |
| 2021-11-02-16.56.26.452000 |
97785032395 |
00:00:12 |
48133 |
4.011 |
240.665 |
peaks near to 24k read/s or 1.300 Millions/min
Regards
------------------------------
Samuel Pizarro
Db2 DBA
Kyndryl
Brazil / Sumaré - SP
Original Message:
Sent: Tue November 02, 2021 12:22 PM
From: Samuel Pizarro
Subject: DMC - Physical Reads metrics discrepancy between Database / Bufferpools level
Investigating a high IO condition here and noticed that DMC has an issue to calculate the Physical Reads/min metrics at database level.
It does not match with real OS metrics observations, and do not match the metrics reported at buffer-pool level as well.
On this particular system we are hitting a 24k IOPS condition in every 2 minutes in average.
When we look at I/O Buffer-Pools metrics, the values seems to be ok.
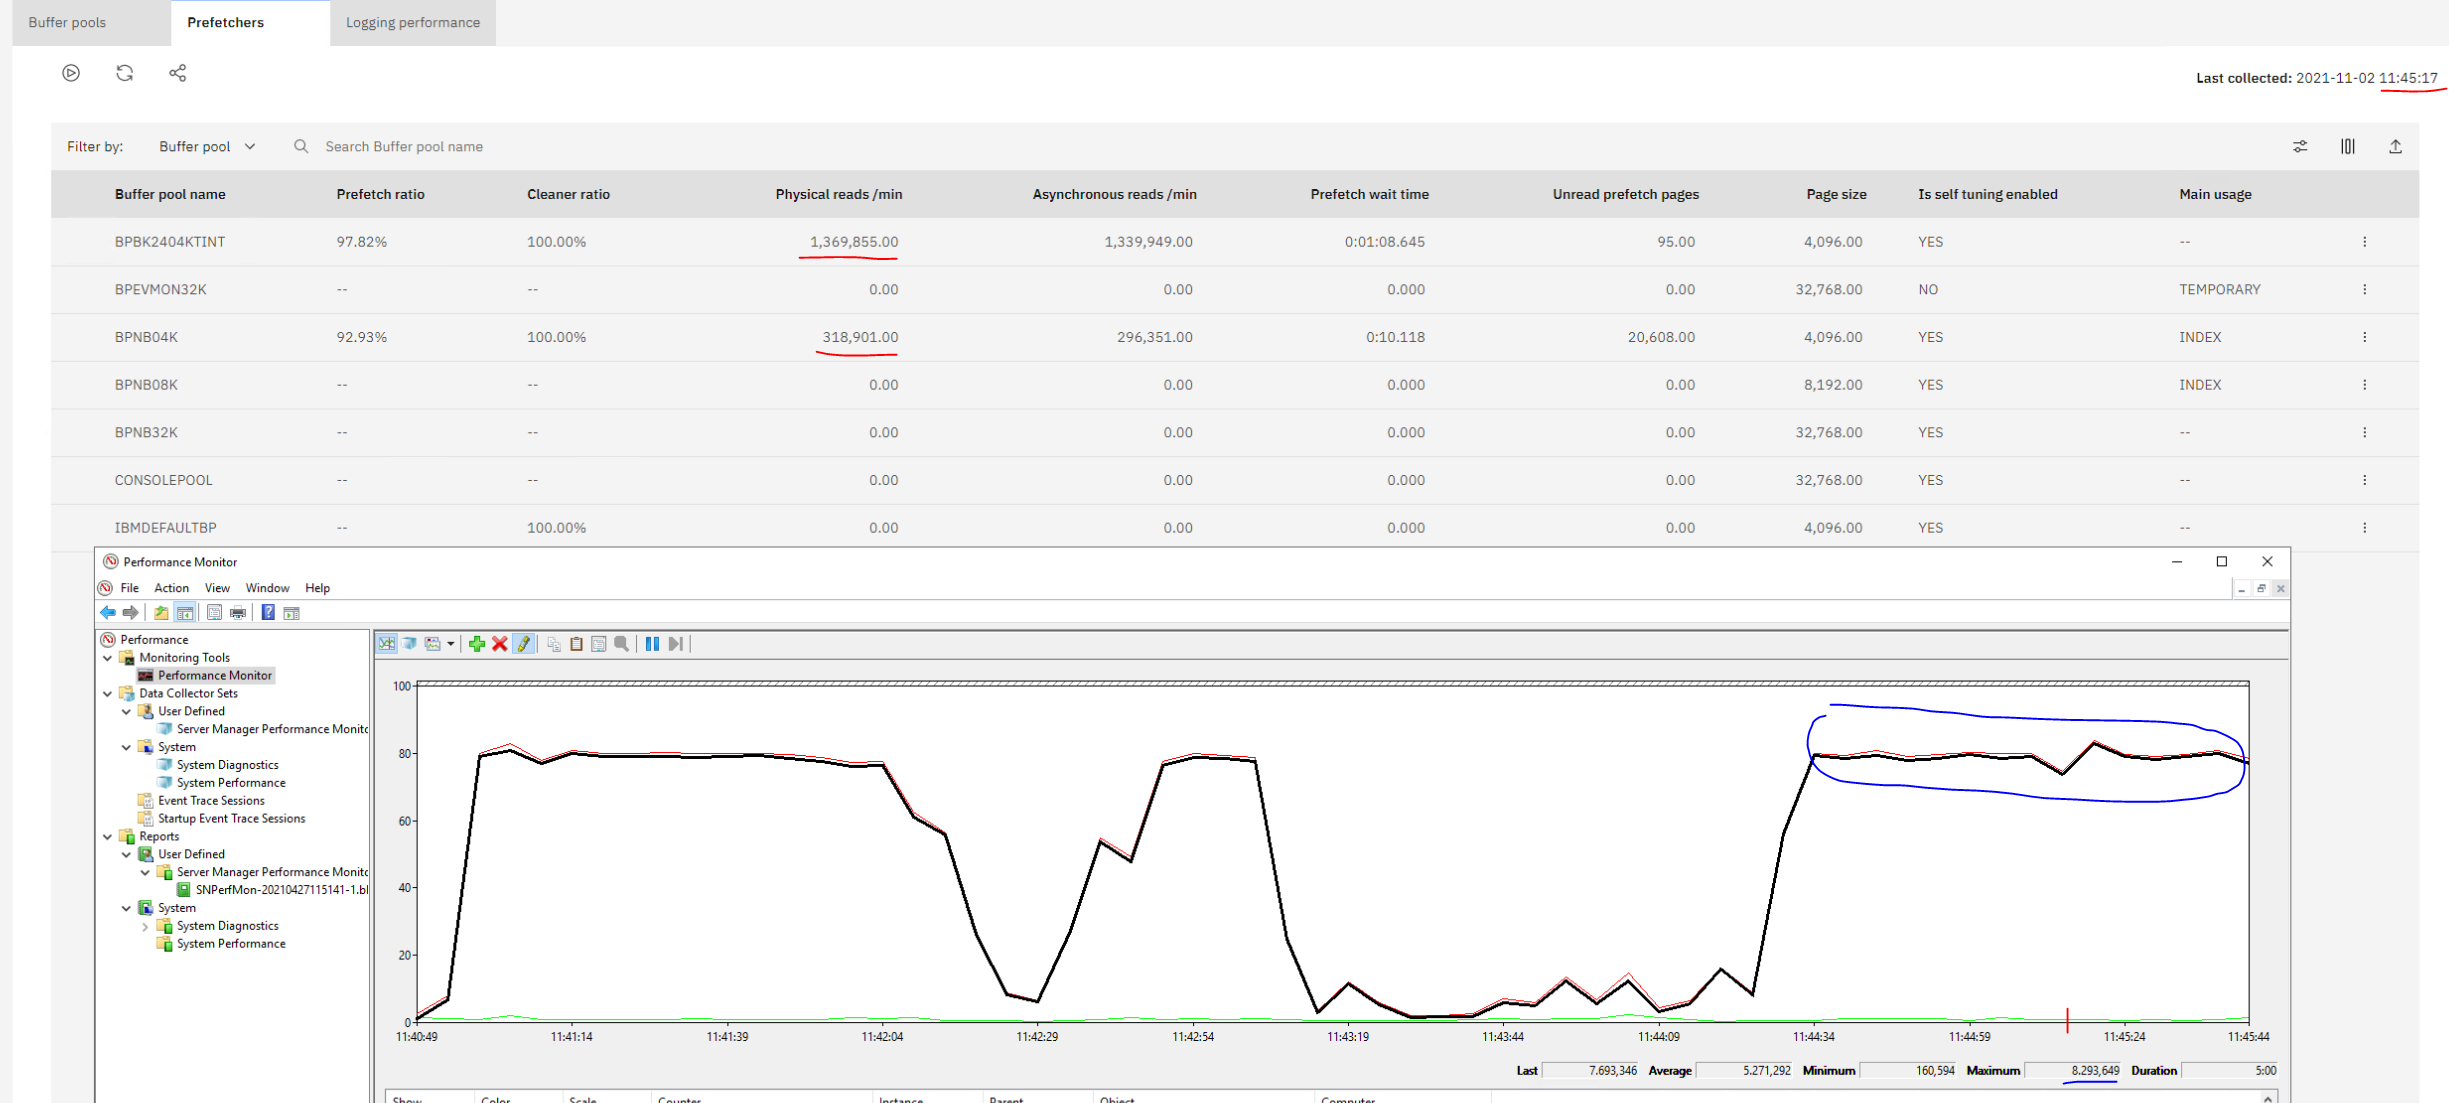
From the above screenshot , the Windows Performance Monitor shows 8k IOPs for 3 different diks (The 3 db storage paths) giving us a 24k IOPs in total.
DMC reports 1,369,855 for one Bufferpool, and 318,901 for another one, summing them up, we have a total of 1,688,756 IOs/min, which give us a pretty similar value of 24 IOPs from windows metrics.
But, when looking at Database level, physical reads/min metrics sows a way lower value of just few k reads per min.
I have reduced the monitor cycle to capture values for each 1 min. and the physical reads/min metric never breaches 70k reads/min,
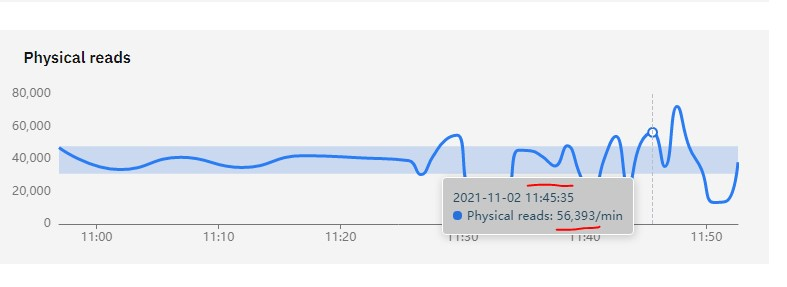
This graph is from Monitor, Database, Database usage page.
The particular point from the same minute 11:45 from the previous view, shows only 56k/min while the BPs one shows a value higher than 1M /min.
Something is definitely wrong here at the database level metric.
Regards
Samuel Pizarro
Db2 Database Administrator
Kyndryl
------------------------------
Samuel Pizarro
------------------------------
#Db2