Db2 Query Monitor: Compare Feature
By Tom Glaser
Date: September 2026
IBM Db2 Query Monitor for z/OS (also referred to as Db2 Query Monitor) is a query analysis tool that analyzes SQL statements and provides accounting details about these queries.
Features
Db2 Query Monitor enables you to:
- Collect, summarize, and display SQL resource consumption down to the level of the individual SQL text statement.
- Collect, summarize, and display Db2 object access statistics down to the individual table and index.
- Access data from multiple Db2 Query Monitor subsystems.
- View data from the perspective of a data sharing group.
- View active SQL statements that are currently being executed by Db2.
- Capture the full text of long SQL statements.
- Disable summary reporting for specific workloads, include or exclude specific -SQLCODES from exception or alert processing, set exception limits and thresholds, and define alert notification thresholds.
- View the expanded text description for an SQLCODE that is supplied by the IBM® utility program DSNTIAR.
- Display host variables.
- View information about the Db2 commands that are executed on monitored Db2 subsystems.
- Collect information relating to exceptional SQL-related events.
- Configure proactive notification to alert users of problems.
- Automate curative actions to deal with exception event as it happened.
- Access consolidated data and events for Db2 subsystems, whether within a single z/OS image or across multiple Db2 images, independent of the existence of a coupling facility.
- View and configure monitoring across your enterprise from a single console.
- …and more.
The purpose of this blog: A key feature of Db2 Query Monitor is the compare feature. The Compare feature allows you to compare SQL performance metrics side-by-side so you can quickly identify changes, trends, regressions, or improvements between workloads, time periods, subsystems, or individual SQL statements. The Compare toggle button shows/hides a set of drop-downs that enable your comparisons. The Compare toggle button is only active in Perspective: Summaries.
Investigate performance degradation
To identify the causes of performance degradations, you must keep data long enough to provide a baseline for a comparison. For the purposes of this discussion, consider a scenario in which you keep two weeks of data (possibly the older data will have been offloaded to Db2). In this case, you are trying to determine why performance is slower this week than it was last week. You choose the source, target, and intervals that define a representative sample of last week's performance metrics. For example, if it is 2:00 pm on Wednesday when the slowness is apparent, you might choose the interval from 2:00 pm the preceding Wednesday, when performance was acceptable. You set this as a baseline. Then you navigate to the source, target, and intervals of the time when performance seemed slow. You can sort by elapsed or average elapsed and then identify the plans, programs and SQL statements that have slowed down the most since last week. You can then investigate the metrics in more detail. It might turn out that an index was dropped since last week, and this can be determined by looking at the objects used by the queries whose performance has degraded the most.
Upgrading Db2
If you plan to upgrade Db2 and wish to see how the performance characteristics are changed by that upgrade, you will capture data from a "typical workload run" in Db2 Query Monitor (and probably offload it to a Db2 database for long-term storage) as a "pre-upgrade baseline" After the Db2 upgrade, you would capture data for a "typical run of the same workload" in Query Monitor.
You choose the source, target, and intervals that hold the data from the "pre-upgrade baseline" and set that as a baseline. You then choose the source, target, and intervals that hold the current data for the "post upgrade" run of the workload. You can then sort by different columns to investigate changes to the performance profile. If the baseline and current data tend to have different numbers of executions, the "Averages columns" will be most useful.
Other scenarios
The same kinds of investigation techniques can also be used to demonstrate performance improvements that have been made by tuning queries, adding indexes, or offloading some queries to an accelerator. Only in these cases would you sort by elapsed or average elapsed in ascending order.
What you can compare:
Compare is commonly used to examine:
- SQL statement performance before and after a change
- Different application workloads
- Different Db2 subsystems or members
- Different time intervals
· Two workload captures – provided you have Db2 Admin Foundation installed
- Historical versus current activity
- Object access statistics and resource consumption metrics
· Before and after a Db2 upgrade
· Before and after an index or statistics change
Metrics commonly compared:
The comparison view can show differences in metrics such as:
- CPU time
- Elapsed time
- Getpages
- Synchronous I/O
- Buffer pool activity
- Sort activity
- Lock waits
- Execution count
- Rows processed
- zIIP usage and zIIP percentage
- Db2 object access statistics
What It Does Not Do
Query Monitor is not a SQL text comparison tool. It will not show:
- Highlighted SQL syntax differences
- Predicate-by-predicate changes
- Differences between DBRMs
- Differences between package versions
- Access path changes at the PLAN_TABLE level
For those types of comparisons, IBM provides:
- Db2 SQL Performance Analyzer
- Db2 Query Workload Tuner
- Db2 Administration Foundation
Typical use cases:
1. Measure the impact of a tuning change:
After creating an index or modifying SQL, compare performance data from before and after the change to verify improvement.
Example:
- CPU drops from 250 ms to 40 ms
- Getpages drop by 90%
- Elapsed time improves by 75%
2. Analyze a performance regression:
Users report an application slowdown. Compare yesterday's SQL activity against today's activity and identify which metrics changed.
3. Compare production vs. test
Determine whether a workload behaves differently in a test subsystem compared to production.
4. Compare members in a data sharing group
Identify workload imbalances or members experiencing higher resource consumption. Db2 Query Monitor can view data from a data sharing perspective and support comparison analysis across the environment.
Comparison Baselines
In the CAE/Web Client, you can create and save Comparison Baselines. A baseline acts as a performance reference point that can later be compared against current activity. These baselines can also be shared with other users through the label-sharing mechanism.
Why DBAs find it useful:
The Compare feature answers questions such as:
- "Did this SQL actually improve after tuning?"
- "What changed after last weekend's migration?"
- "Why is subsystem A consuming more CPU than subsystem B?"
- "Which metrics increased when response time got worse?"
- "Did zIIP offload improve after the application change?"
Instead of manually reviewing multiple reports, the Compare function highlights the metric differences in a single view, making root-cause analysis much faster.
In the Db2 Query Monitor CAE/Web Client, the Compare capability is typically built around Comparison Baselines. This allows you to save a set of performance metrics and later compare newer activity against that saved baseline.
Creating a Comparison Baseline:
Method 1: From an Activity Summary
- Open Activity Summaries.
- Filter to the workload, plan, package, auth ID, SQL statement, or time period of interest.
- Select the row(s) you want to use as your reference point.
- Look for a menu option such as:
- Compare
- Create Baseline
- Save as Comparison Baseline
- Give the baseline:
- A meaningful name
- Optional description
- Sharing option (Private or Shared)
- Optional Label
- Save the baseline. It is now available for future comparisons.
Running a Comparison:
- Navigate to the same activity view.
- Select the current workload or SQL statement.
- Choose Compare.
- Select a previously saved baseline.
- Execute the comparison.
Db2 Query Monitor then displays the current metrics alongside the baseline metrics and highlights differences.
Example
Suppose an application team adds an index Friday night.
Baseline (Before Change)
|
Metric
|
Value
|
|
CPU Time
|
1.8 sec
|
|
Elapsed Time
|
5.4 sec
|
|
Getpages
|
1,200,000
|
|
Sync I/O
|
18,000
|
Current (After Change)
|
Metric
|
Value
|
|
CPU Time
|
0.6 sec
|
|
Elapsed Time
|
1.2 sec
|
|
Getpages
|
120,000
|
|
Sync I/O
|
1,800
|
The Compare display immediately shows:
- CPU reduced 67%
- Elapsed reduced 78%
- Getpages reduced 90%
- I/O reduced 90%
This provides objective evidence that the index improved performance.
Metrics Worth Comparing
When reviewing the comparison output, I normally focus on:
Performance
- Class 1 elapsed time
- CPU time
- zIIP time
- zIIP percentage
- Average execution time
Access Efficiency
- Getpages
- Buffer pool activity
- Synchronous reads
- Prefetch activity
- Index usage statistics
Workload Activity
- Execution count
- Rows read
- Rows returned
- Commit activity
- Locking activity
Sharing Baselines with Other Users
One of the lesser-known features is that comparison baselines can be shared.
You can:
- Create a baseline.
- Assign a Label.
- Share it with other Query Monitor users.
This is useful when multiple DBAs need to compare against the same "gold standard" workload after an application deployment or Db2 migration.
A Practical DBA Use Case
For a Db2 migration from 12 to 13:
- Collect a week's worth of production activity.
- Save key SQL workloads as comparison baselines.
- Perform the migration.
- Run the same workload.
- Compare:
- CPU
- Elapsed
- Getpages
- zIIP %
- I/O activity
Any significant increase immediately stands out and points you to SQL statements that may need further analysis in Db2 SQL Performance Analyzer or Query Workload Tuner.
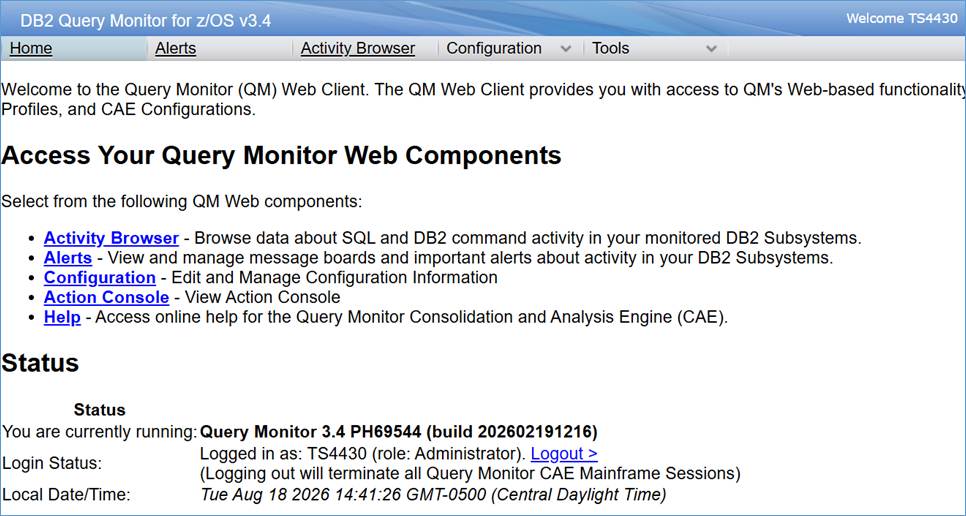
Let's look at a few examples. A job ran called DB2TOOLS yesterday. The same job ran today. Let's compare the results of this job. The first place to start is to bring up the Db2 Query Monitor web client interface. This will be a URL address space followed by a port number. Port 443 is the default. Once logged in, click on Activity Browser.
When the activity browser comes up, click on the "Compare" ICON:
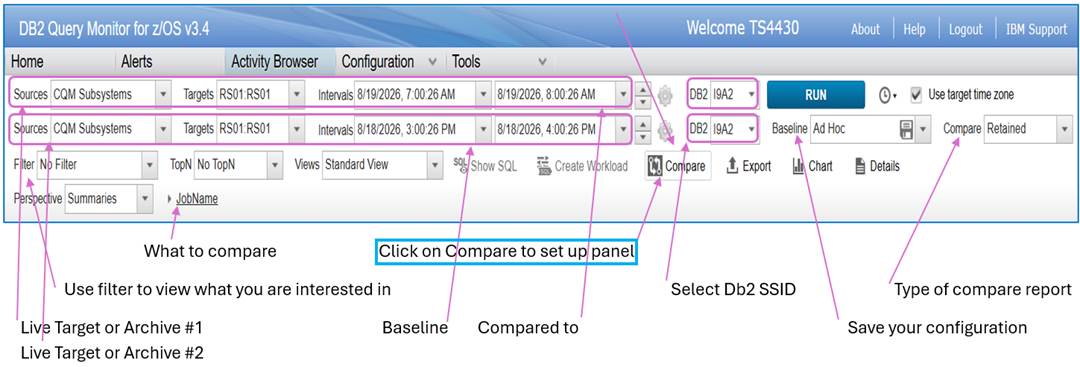
Let's review the fields that are important to us. The top two "source" is the Db2 SSID or SSID(s) to be compared. Note the arrow mentions this could be an archive. If you click on the drop-down arrow and you've set up the Db2 Query Monitor performance database, you can point your browser to the archived data. Your archived data will now be brought back online.
Source 1: The interval time is from 07:00am to 08:00am on August the 19th:

To be compared with the baseline, from 03:00pm to 04:00pm on August the 18th:

You can use the filter to filter out data you don't want to see. In our example, I am not filtering out any data.
What do you want to compare? A Db2 subsystem ID, a plan, a package, a singe SQL statement? In our example, we are comparing a batch job named DB2TOOLS.
The "compare" drop-down menu have multiple options:
All: Shows the comparison data for all statuses (retained, added, and removed)
Retained: Shows the comparison data for retained metrics. Retained metrics are present in both the baseline workload and the current (comparison) workload.
Added: Shows the comparison data for added metrics. Added metrics are not present in the baseline workload but are present in the current (comparison) workload.
Removed: Shows the comparison data for removed metrics. Removed metrics are present in the baseline workload but are not present in the current (comparison) workload.
Baseline: Only the data from the baseline is shown for the current drill-down. No comparison is made.
Current: Only the data from the current target (the selected source, target, and set of intervals) is shown. No comparison is made.
I personally like the "retained" option the best.
After you have this report setup, you can save it so that in the future, you can pull up a similar report. This is the drop-down menu next to the "baseline" field called Ad Hoc.
You can compare an entire Db2 subsystem down to a single SQL statement. In our first example, we submitted a batch job called DB2TOOLS and want to compare the run times. Let's change the Summaries Perspective from Plan (the default) to Job Names (JN). We are now going to compare the run times between both jobs.
To review:
Step 1: Define a baseline workload
Step 2: Define a current workload
Step 3: Compare workloads
Step 4: Saving and sharing a baseline
Now that all the options on this header are all filled in, hit the enter key or click on the Run Key.  In our example, the following screen will be returned.
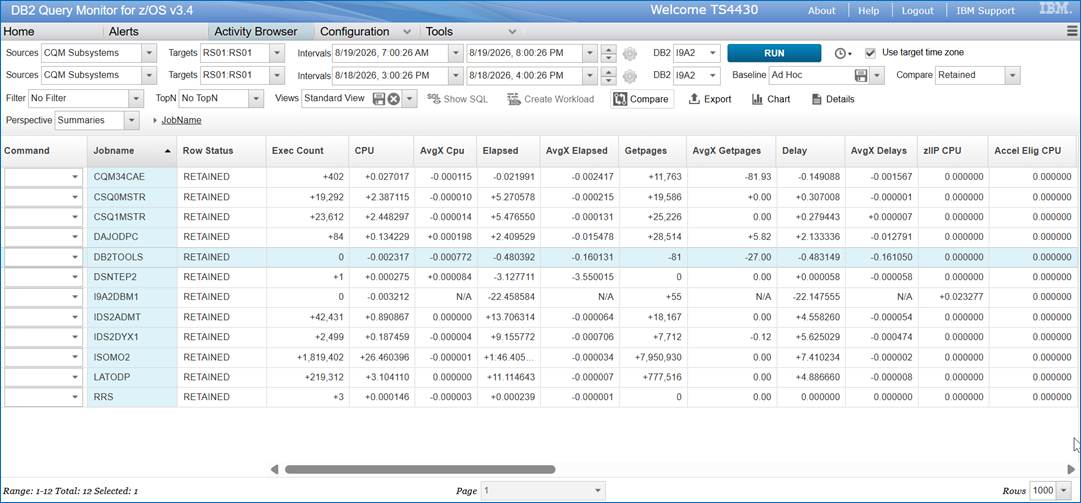
In the example above, we are looking at the batch job called DB2TOOLS; this line is highlighted in light blue. Each field will have a + and – sign net to the integer value. This tells us there has been an increase or a decrease in values for that field. For example, let's look at the elapsed time for this batch job. Hoover your mouse pointer of the data values in the grid.
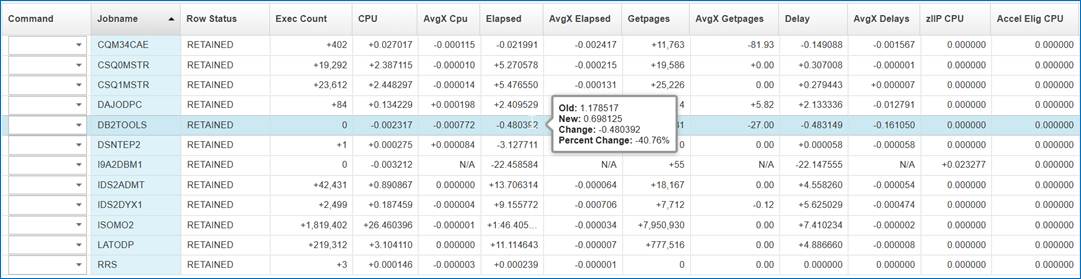
18th is 1.178517….this is the baseline; this is the "old" value.
19th is 0.698125 for total elapsed time; this is the new comparison.
By looking at the negative (-) value, we can easily see there's a decrease in elapsed time. In fact, a 40.76% percent improvement. A negative value is a good thing. A positive value indicates an increase in the field.
Looking at another example, we can see there is also a decrease in CPU, another good thing. Of course, this is a very small job and the values are quite small.
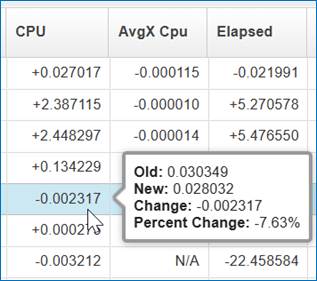
Going one step further, you can drill down into the SQL statements. In our example, I'm entering or selecting the S for SQL option.
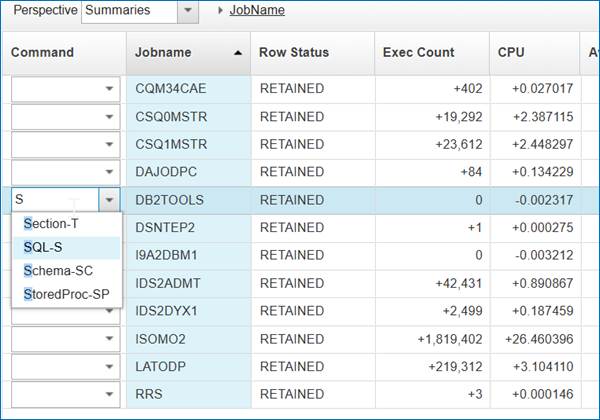
Drilling into the batch job, we can see SQL statements:
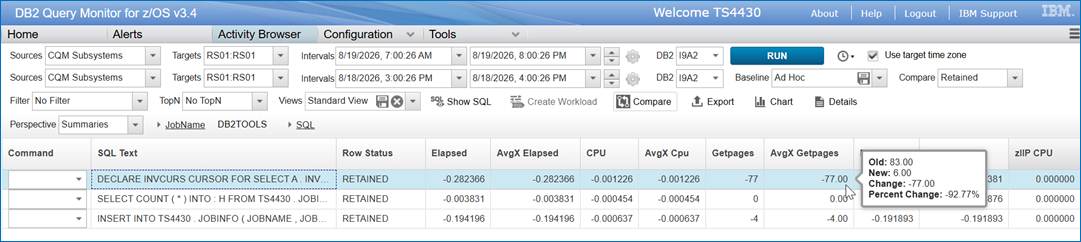
In looking at the getpage or the average getpage activity, there has been a decrease by 77 pages of data, another good thing. A value of 0 indicates the values for both comparisons are the same.
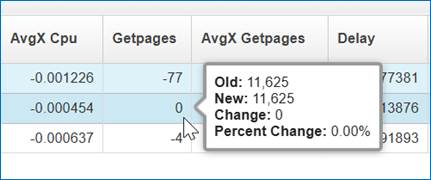
We can take this one step further and compare one Db2 subsystem to another or compare the same Db2 subsystem against a 24-hour period over 2 days.
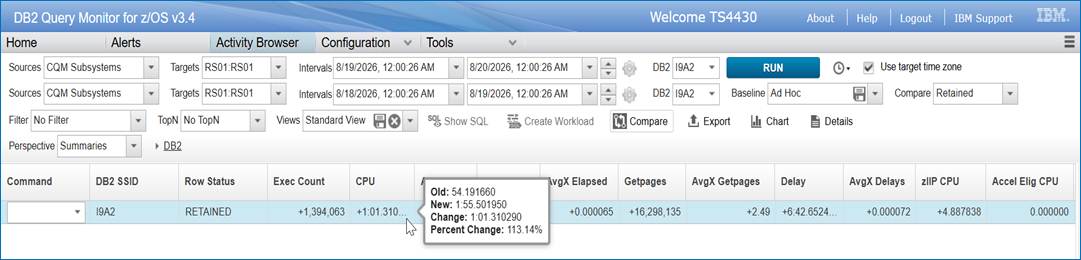
In this example, the 19th consumed 1 min 55 seconds of CPU compared to the previous day, which only consumed 54 seconds of CPU, which explains the plus (+) sign. In a production environment where you might be looking at hours of CPU costs, you can then drill down to find what's impacting the increase or decrease in a field.
Remember: In all cases, positive values (increases) are displayed with a "+" sign in front, while negative values (decreases) are displayed with a "-" sign in front.
In Summary: In this blog, I've shown you how to compare metrics between SQL statements, batch jobs or a Db2 subsystem. If you have any suggestions on how to enhance batch reporting for Db2 Query Monitor or any other function within this tool, please submit an Aha on IBM's web page.
https://ibm-data-and-ai.ideas.ibm.com/ideas/?project=DB2ZQUEMON
------------------------------
Tom Glaser
------------------------------