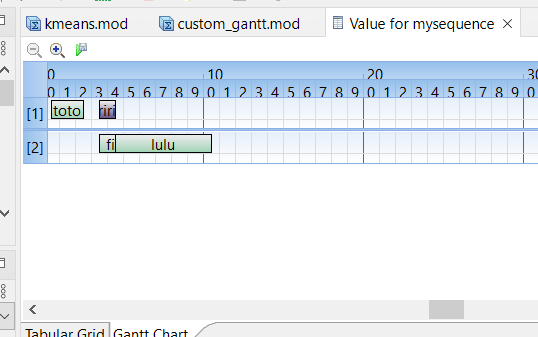
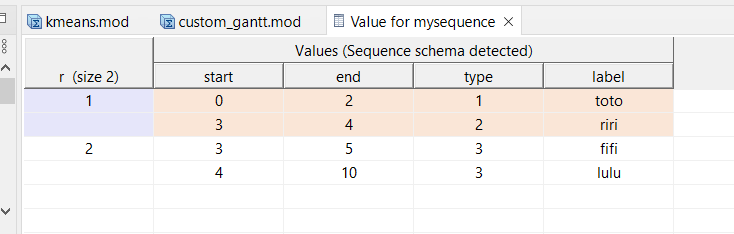
You may use an undocumented feature of the IDE that allows some tuple(sets) with sequence like (or interval like) structure to be displayed as Gantts.
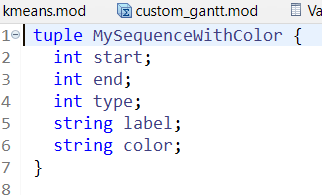
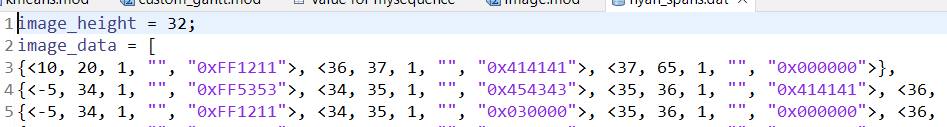
you can also specify colors...
gives :
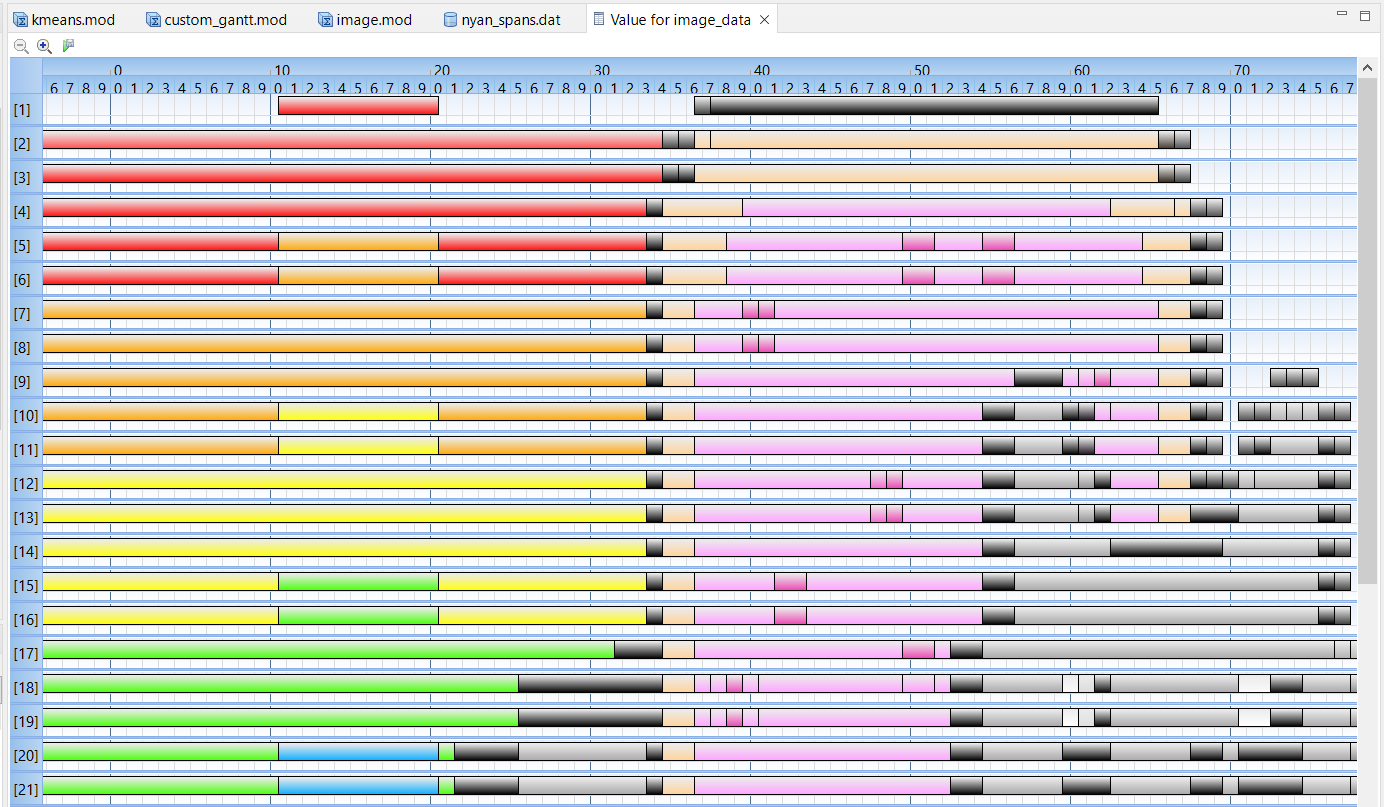
Using this feature you can create a Gantt from scratch with no interval or sequence elements in your model.
You should be able to create post-processing gantt-compatible elements from your sequence,
for example with scaled values, although I am not enough an expert in OPL language (or scripting) to know how exactly)
------------------------------
Frederic Delhoume
------------------------------
Original Message:
Sent: Thu May 12, 2022 10:06 AM
From: Frederic Delhoume
Subject: Change scale of gantt chart
I see, it may exceed some PNG or SWT (the toolkit we use in the IDE) dimension limit (or memory usage limit).
You might have only one option here, export your data (or scale it somehow) using some scripting or external tool.
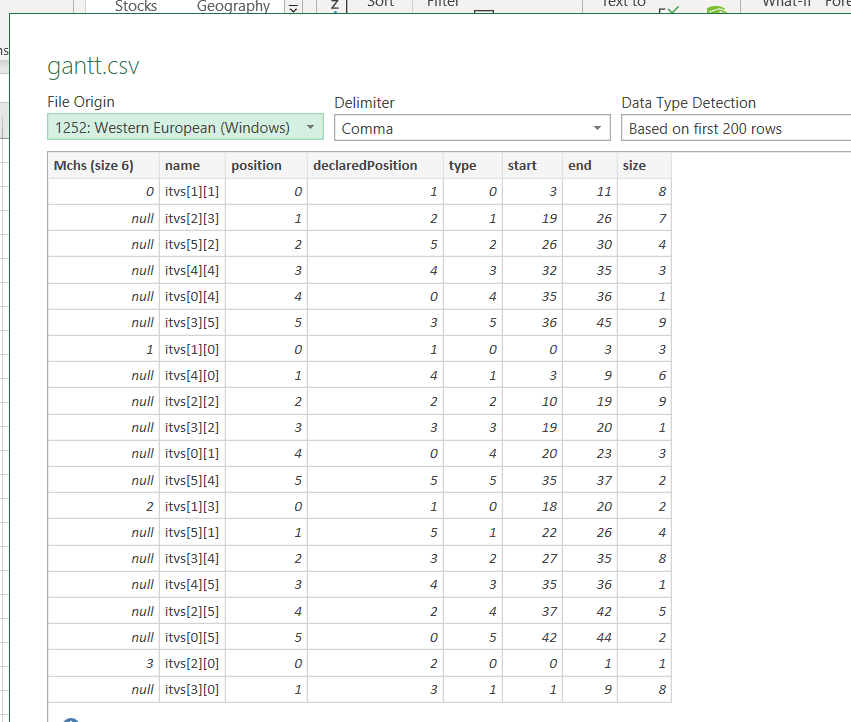
You can copy the sequence (and interval) tabular dataview to CSV using CTRL-C or right click and menu, then import into Excel or other program,
but you will have to make this program understand the format (with n lines per sequence)
------------------------------
Frederic Delhoume
Original Message:
Sent: Thu May 12, 2022 09:46 AM
From: Vasco Ferreira
Subject: Change scale of gantt chart
Thank you for answering! However, when I export to an image, the png is corrupted. Also, when previewing the gantt it is acting weird with these ranges, it doesn't show the bars however on the table it has intervals.
------------------------------
Vasco Ferreira
Original Message:
Sent: Thu May 12, 2022 09:20 AM
From: Frederic Delhoume
Subject: Change scale of gantt chart
Hi,
I assume you are using COS 22.1
Unfortunately the gantt component we use is limited in its (un)zooming capabilities.
This new component is https://www.eclipse.org/nebula/widgets/ganttchart/ganttchart.php
It can only unzoom to units and not arbitrary levels.
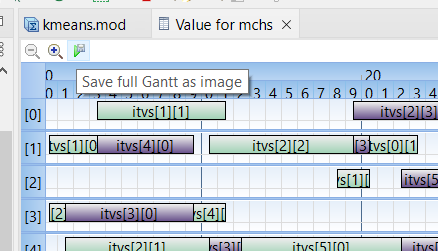
You may use the "save gantt as full image" button and visualize the whole gantt image externally with an image viewer.
Another (more complicated) possibility is to somehow export your scheduling results to an external gantt format that might be displayed
in another program.
The gantt component used to be different in previous COS versions (up to 20.1), you may use one of these versions and have different (un)zooming capabilities.
------------------------------
Frederic Delhoume
Original Message:
Sent: Thu May 12, 2022 03:55 AM
From: Vasco Ferreira
Subject: Change scale of gantt chart
Hello,
How can i change the scale of the gantt chart? The zoom is limited and i have big intervals, i cannot see everything at once
------------------------------
Vasco Ferreira
------------------------------
#DecisionOptimization