Hi Loic.
With the new visualizations, this is not possible (yet). But you can use the old charts. The combination chart can do almost everything.
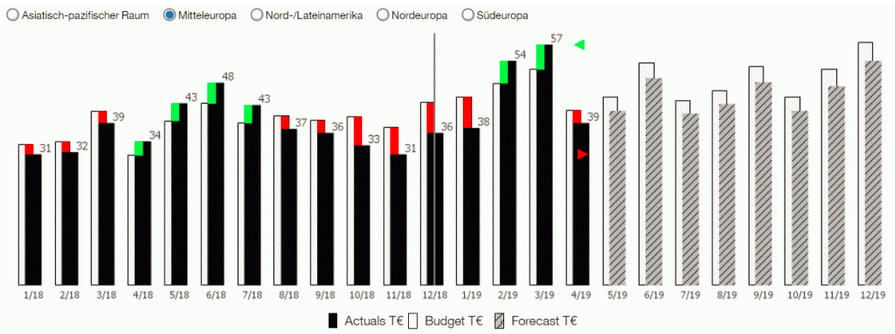
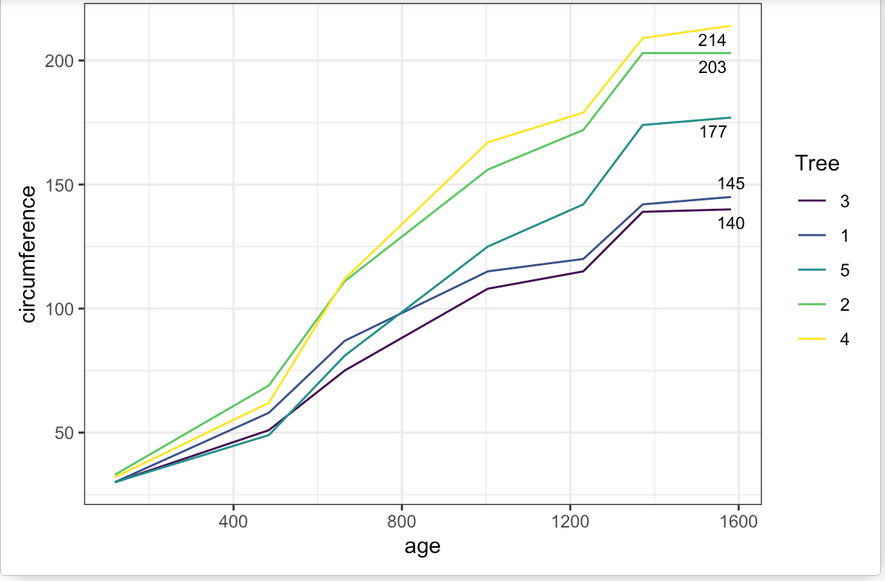
In your case you have to combine two line charts. The first one for the lines, the second one only for the values. Values that should not be displayed must be NULL (best with an IF-THEN-ELSE calculation):
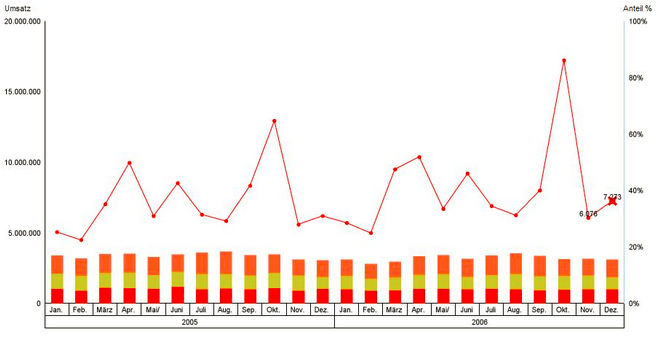
This makes really complex diagrams possible:
Jens
------------------------------
Jens Bäumler
Senior Consultant and Trainer
Apparo Group
------------------------------
Original Message:
Sent: Thu April 15, 2021 03:22 PM
From: LOIC POTIN
Subject: How to Display the Last Value of Each Line as Label in a chart
Hello All,
I would like to know if it is possible to get the last values of each Line in a chart. I work with CA 11.1.7 and i haven't found how to do this with the 11.1 charts.
Furthermore, i need to have this chart in PDF and HTML output.
Any suggestion ? Thanks.
------------------------------
LOIC POTIN
------------------------------
#CognosAnalyticswithWatson