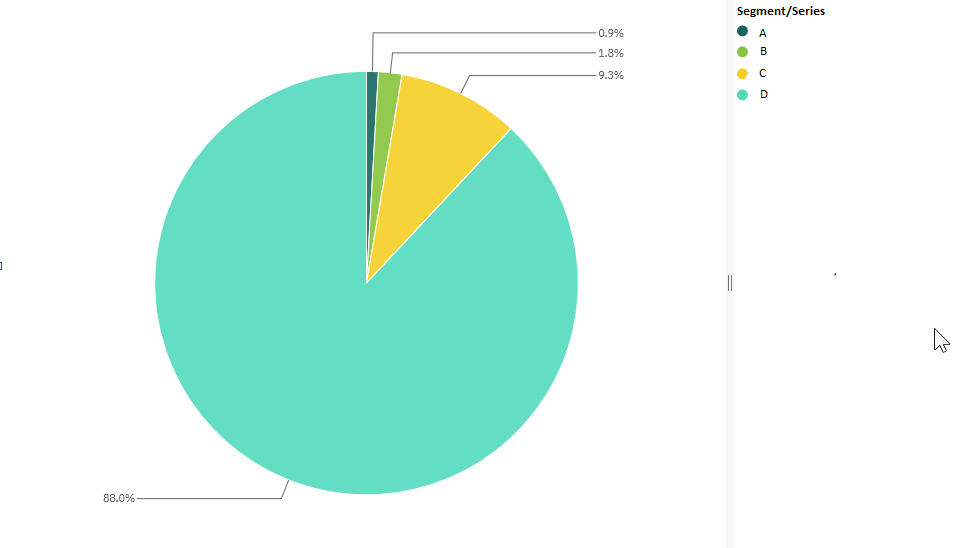
Hi everyone, I have this pie chart I created in a dashboard:
I have a few questions about formatting that for the live of me I'm not able to figure out or find any answers for online:
1. Instead of showing the legend, I'd like to show the segment/series names above the data percentage numbers. How can I do that?
2. How can I format those data percentage numbers to have no decimals?
3. When I'm editing/displaying this dashboard in the Chrome browser, I don't see the data percentage numbers at all. When I edit/display it in Internet Explorer, I see the data percentage numbers. Why are the numbers not displaying in Chrome?
Thanks so much for any help you can provide. Take care, Melody Alberti
------------------------------
MELODY ALBERTI
------------------------------
#CognosAnalyticswithWatson