Co-Author: @CONOR MURPHY
Overview
In today’s fast-paced digital landscape, ensuring the performance and scalability of enterprise applications is not just a best practice—it’s a necessity. IBM Cloud Pak for Business Automation (CP4BA) is a powerful platform that integrates multiple automation capabilities, but validating its performance under real-world load conditions can be challenging.
This blog walks you through how to combine Apache JMeter (for generating realistic integration workloads) with IBM Instana (for real-time observability) to uncover performance bottlenecks, resource inefficiencies, and scalability challenges within CP4BA.
Traditional load testing alone can’t reveal where the real bottlenecks lie across distributed components. That’s where combining Apache JMeter and Instana delivers real power. JMeter generates realistic load patterns for CP4BA integration scenarios, while Instana provides real-time observability into how the platform’s underlying services respond.
Using JMeter alone answers “how fast are my APIs?” Using Instana alone answers “how healthy is my platform?” Together they answer the most important question: “Why is the system slow under this exact load pattern?”
Organizations adopting this approach typically achieve:
-
Faster root-cause analysis through correlated traces
-
Early detection of memory leaks before production
-
Accurate capacity planning based on real resource curves
-
Reduction of critical performance defects in UAT cycles
By the end of this article, you’ll know how to:
-
Design JMeter tests tailored to CP4BA’s multi-service integration scenarios.
-
Use Instana to visualize live performance metrics across CP4BA components.
-
Correlate load metrics from JMeter with infrastructure and application metrics from Instana to pinpoint issues faster.
Why Performance Visibility Matters in CP4BA
Integration workloads in CP4BA often span across several microservices — Business Automation Workflow (BAW), Content Cortex, (CCx) Decision Intelligence Client Managed Software (DICMS), and others. Each component communicates over the network, depends on shared databases, and consumes compute resources dynamically.
Validating such scenarios under load is complex because:
-
A slowdown in one service can cascade across others.
-
Root causes are rarely visible through response times alone.
-
Containerized environments make it difficult to trace resource consumption at the pod or JVM level.
That’s where JMeter + Instana together make the difference.
-
JMeter applies controlled and reproducible load.
-
Instana continuously monitors application health, container metrics, JVM behavior, and infrastructure utilization — all in real time.
This combination gives teams a closed feedback loop: from generating load to observing, diagnosing, and optimizing system performance.
JMETER
Apache JMeter is an open-source, Java-based performance testing tool primarily used to test the non-functional behaviour and measure performance of web applications and various other services.
The latest stable release of Apache JMeter is available for download from the official Apache Software Foundation website <here>
Designing JMeter Tests for CP4BA Integration Workloads
Rather than focusing on generic JMeter basics, the goal here is to design workloads that reflect real use cases. In CP4BA, business value is driven by the volume of work processed, not just the number of users logged in. A deployment serving 100 users may process significantly more work than another supporting 1,000 users, depending on the complexity of workflows, document operations, and decision executions.
For this reason, IBM recommends sizing environments based on business transactions and workflows, using standardized Small, Medium, and Large deployment profiles, as described <here>. This should be used as baseline sizing guidelines only. Actual performance testing must be tailored to each customer's unique business processes, transaction mix and usage patterns.
CP4BA JMeter Test Plan Structure
This JMeter test plan models realistic CP4BA business workloads by organizing scenarios across key platform components, including Business Automation Workflow, Content Cortex, Application Engine, and Decision Services. Controllers such as Weighted Switch Controller and Random Controller are used to simulate production-like transaction distribution, ensuring that document operations, workflow activities, and decision invocations occur in proportions that reflect actual business usage patterns.
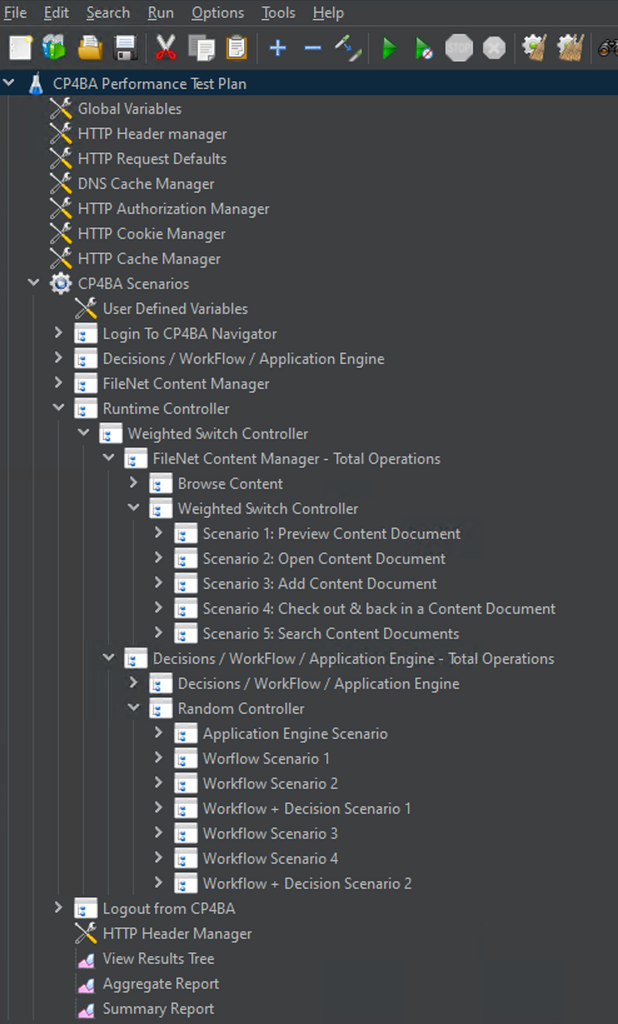
Figure 1: Jmeter Test Plan for CP4BA
1. Identify Integration Points
Typical integration entry points in CP4BA include:
-
REST APIs for business automation services.
-
BAW process starts or completion endpoints.
-
Content upload/download APIs from FileNet.
-
Business rules or decision service invocations.
2. Parameterize and Correlate Requests
Use CSV Data Sets and PostProcessors (e.g., Groovy scripts) to dynamically pass data between dependent API calls — simulating real business process flows.
For example:
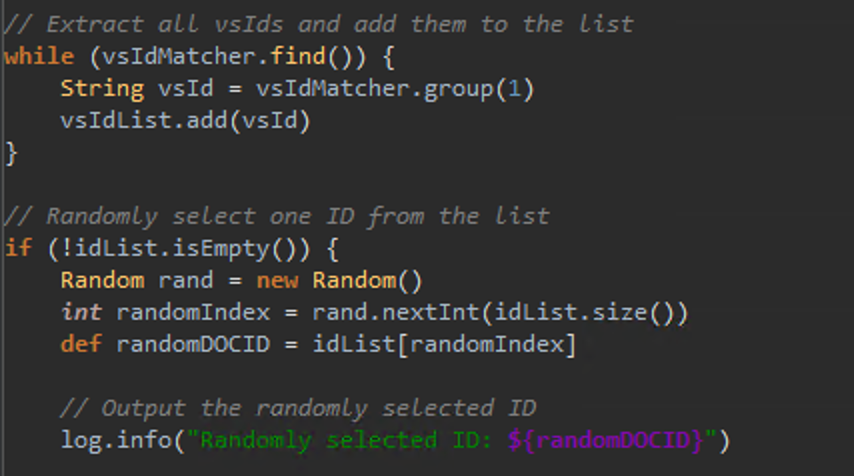
Figure 2: Groovy snippet from Jmeter
3. Distributed Load Execution
For large-scale testing, run JMeter in distributed mode with multiple load generators to simulate hundreds of concurrent users.
A typical setup:
-
JMeter master on Jenkins or a control node.
-
Multiple Windows JMeter slaves executing the test plan.
-
Results aggregated in .csv files and HTML reports.
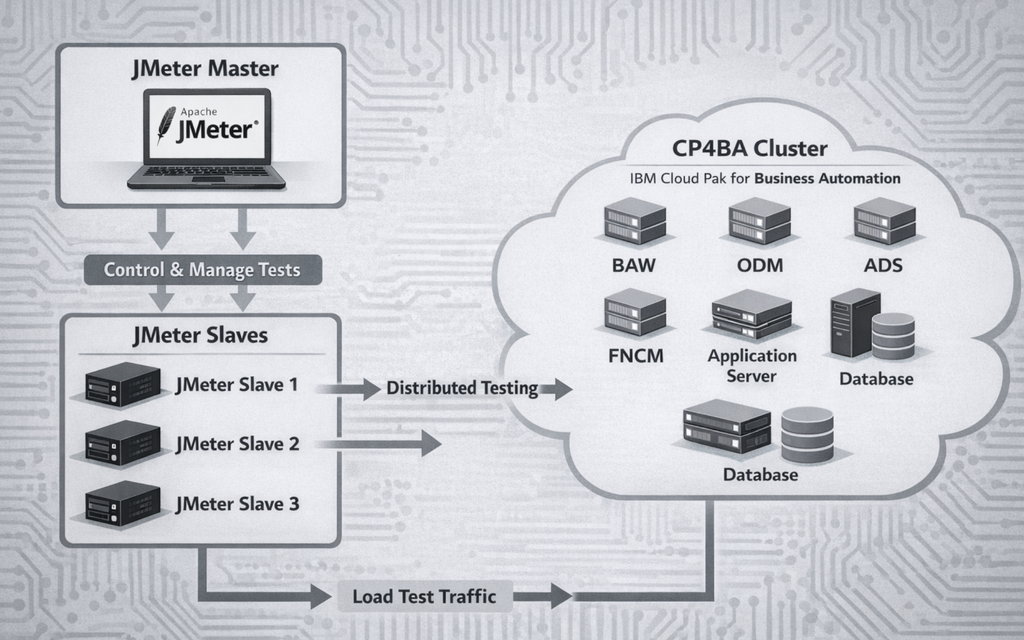
Figure 3: Distributed JMeter Load Testing Architecture for CP4BA
4. Key Jmeter Metrics to Capture
-
Response time and throughput per transaction.
-
Error rate and failed transaction ratio.
-
Concurrent users and operations per hour.
-
95th and 99th percentile of average response time.
INSTANA
IBM Instana is an enterprise observability platform providing Application Performance Monitoring (APM) for cloud-native, microservices, and containerized applications, offering automated, real-time, full-stack visibility, AI-driven root cause analysis, and end-user monitoring.
It is the real-time observability layer that converts JMeter load results into root-cause insights across CP4BA infrastructure, middleware, and applications.
Monitoring CP4BA in Real Time with Instana
While JMeter provides synthetic load data, Instana provides live telemetry from CP4BA components during the test.
1. Setting Up Instana Monitoring
-
Ensure that Instana agent is deployed across the CP4BA cluster nodes.
-
Configure it to auto-discover Kubernetes pods, JVMs, and middleware components.
-
Label your namespaces or deployments (e.g., cp4ba-baw, cp4ba-content) for logical grouping in Instana.
2. Key Metrics to Observe
During load execution, track:
-
CPU / Memory utilization of CP4BA pods (especially Workflow, Content, and Decisions).
-
JVM metrics: heap usage, garbage collection activity, thread count.
-
Database metrics: connection pool usage, slow queries.
-
Network I/O: latency and throughput across service calls.
-
Storage I/O: read/write latency for FileNet repositories.
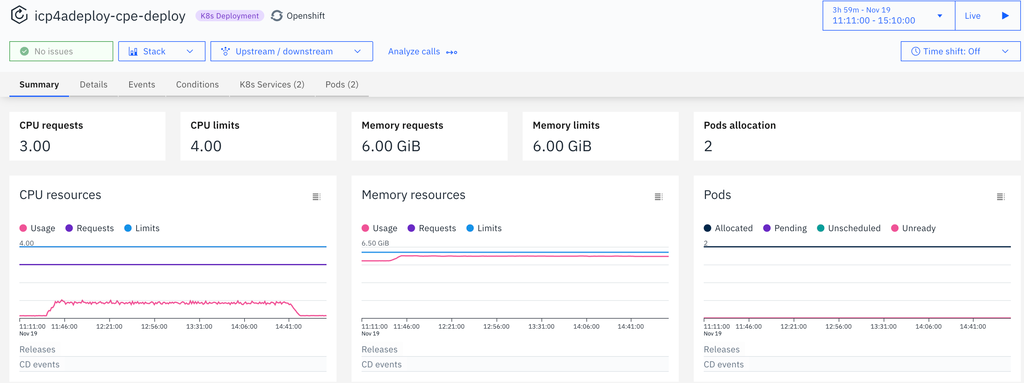
Figure 4: Instana Dashboard Showing Real-Time CPU, Memory, and Pod Metrics for a CP4BA Deployment
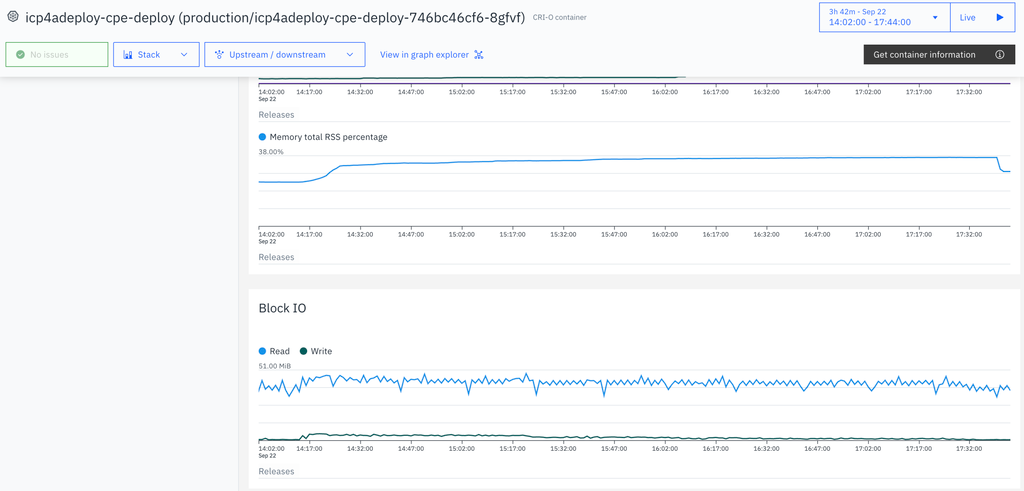
Figure 5: Container-Level Memory and Storage I/O Monitoring for CP4BA Content Platform Engine
3. Using Instana Dashboards
Create custom dashboards to overlay:
-
JMeter load parameters (users, throughput).
-
CP4BA system metrics (CPU, memory, GC).
-
Application response times or errors from Instana traces.
Correlating JMeter and Instana Data
Once the load test is complete, analyze both perspectives together.
1. Detect Bottlenecks
Look for time-aligned patterns:
2. Identify Memory Leaks
Compare heap memory growth between test runs.
If Instana shows uncollected memory across iterations, you’re likely observing a memory leak in the service or its dependent microservice.
3. Assess Scalability
Increase JMeter’s concurrent users gradually and observe Instana’s resource usage curve.
You’ll discover thresholds — e.g., the point where horizontal scaling or JVM tuning becomes necessary.
Common Performance Issues and how to fix them
1. Misconfigured JVM Heaps
-
JMeter response time gradually increases while Instana shows JVM heap utilization above 85–90% on BAW/CPE pods.
-
Frequent Garbage Collection pauses in Instana coincide with drops in JMeter throughput.
-
Compare GC activity before and during peak load.
-
If full GC cycles increase with user count and recovery is slow, the heap is undersized
Fix: Right-sizing heap
-
Small DB Connection Pools
-
JMeter shows rising errors and timeouts while Instana reports DB connection pool usage hitting 100%.
-
Database response time spikes even though CPU on application pods remains low.
-
Correlate slow SQL traces with JMeter transactions that perform case creation or document upload.
-
Observe retries or HTTP 5xx during peak load.
Fix: Increase pool size, tune statement cache, and review long-running queries
-
FNCM / Storage Latency
-
JMeter steps involving document upload/download become slow while Instana shows high disk I/O latency on CPE or object storage.
-
FileNet API duration increases sharply.
-
Compare Instana storage graphs with JMeter samplers for content operations.
-
If latency rises even with low CPU, the bottleneck is external storage or NFS/object tier.
Fix: Optimize storage class, enable caching on CPE.
Customer Impact
By integrating JMeter and Instana in your performance testing pipeline, you can:
-
Validate integration performance in real-time — not just after-the-fact reports.
-
Troubleshoot issues faster using correlated metrics from application to infrastructure.
-
Identify issues earlier in the testing lifecycle, prevents late surprises.
-
Plan capacity more intelligently, understanding how CP4BA scales under load.
-
Ensure robustness and scalability of your deployments before production rollout.
This approach transforms performance testing from a one-time activity into a continuous performance intelligence process — making your CP4BA deployment more reliable, observable, and ready for enterprise workloads.
Conclusion
Enterprise automation platforms are expected to process growing volumes of workflows, documents, decisions, and integrations without compromising reliability. Achieving this requires more than executing load tests; it requires understanding how every layer of the platform responds as business demand increases. By combining realistic JMeter workload models with Instana's end-to-end observability capabilities, organizations can transform raw performance data into actionable insights. Whether you’re validating a new deployment, investigating slow workflows, or tuning your infrastructure for scale, this combination provides the load-to-insight visibility every enterprise needs, giving organizations the confidence that their automation platform will remain robust, scalable, and efficient—even under the most demanding business workloads.