IBM Envizi ESG Suite · A guided tour for Maximo people
Maximo knows your assets and TRIRIGA knows your buildings. Neither will tell you how many tonnes of CO2 the company emitted last year, or produce the answer an auditor will accept. That is the job of IBM Envizi. This guide walks through it on IBM's demo organisation in six use cases: build the data foundation, report emissions, answer a disclosure, then go deep on Scope 3, on energy, and on planning the reduction. Every number comes from a screen.
Watch first: from a gas bill to a reduction plan, in under six minutes, on the same screens as the guide.
What you will learn
- What Envizi is, and how its five menus map to the work of a sustainability team.
- The data model in four words: group, location, account, record.
- Use case 1: the data foundation, down to one natural gas account.
- Use case 2: emissions reporting: Scope 1, 2 and 3, PowerReports, performance against last year.
- Use case 3: disclosures: the Sustainability Reporting Manager and its frameworks.
- What happens next: programs and actions to reduce the number.
- Use case 4: Scope 3 in depth: the four calculation methods, leased space, financed emissions.
- Use case 5: energy intelligence: bills, interval meters, and proving that an upgrade worked.
- Use case 6: planning: business as usual, target, the gap, and which actions close it.
- The modules, and how to spot a need.
Reading time: about 35 minutes; sections 1 to 7 are the 15-minute tour. System: IBM Envizi ESG Suite, demo organisation "Demo Corporation US".
Contents
- What Envizi is
- Five menus, one working cycle
- The data model: group, location, account, record
- Use case 1: build the data foundation
- Use case 2: report emissions
- Use case 3: answer a disclosure
- After the report: programs and actions
- Use case 4: Scope 3 in depth
- Use case 5: energy intelligence
- Use case 6: plan the reduction
- The suite, module by module
- Spotting a need
- Things to get right early
- Check yourself
- Glossary
In Maximo terms · the translation table
| You know (Maximo, TRIRIGA) |
In Envizi |
| Site, location, building |
Location: a place where data is collected. 662 in the demo. |
| Location hierarchy, classification |
Groups: several hierarchies over the same locations (by region, by business group, by portfolio) |
| Meter on an asset |
Account (monthly bill-style data) or Meter (interval readings) |
| Meter reading |
Record: a quantity, a cost and a period on an account |
| Meter type, unit of measure |
Data type and account style: "Natural Gas (GJ)", "Electricity (kWh)" |
| Start Center, KPI |
Summary pages and PowerReports (embedded Power BI) |
| Work order, PM, job plan |
Program, action plan, action in the Optimize menu |
| Nothing equivalent |
Emission factors, kept by Envizi, that turn kWh, litres and dollars into CO2e |
1. What Envizi is
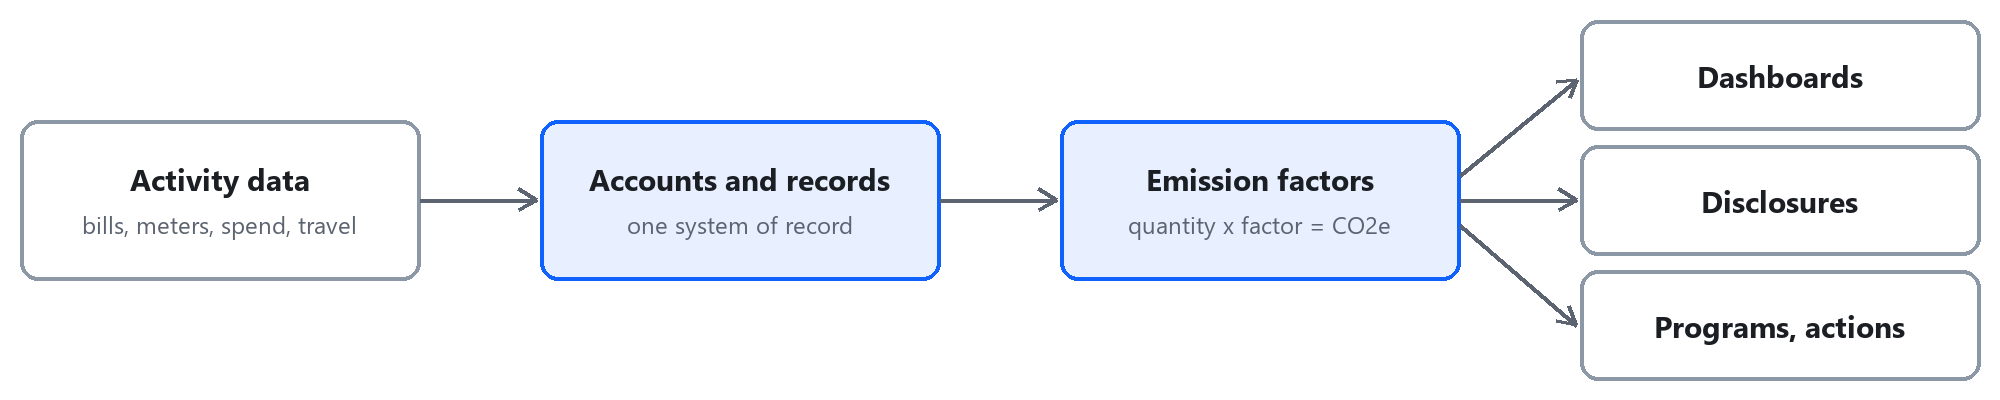
Envizi is a system of record for environmental, social and governance (ESG) data. In plain words it does four things:
- Collects activity data: electricity and gas bills, water, waste, fuel, business travel, purchases.
- Converts it to emissions with emission factors it maintains, and sorts the result into Scope 1, 2 and 3.
- Reports it: internally in dashboards, externally in disclosures such as CDP, GRI, ESRS or TCFD.
- Tracks the reduction: targets, and the programs meant to reach them.
The three scopes, in one line each. Scope 1: what you burn yourself (gas boilers, fleet fuel, refrigerant leaks). Scope 2: the electricity, heat and cooling you buy. Scope 3: everything else in your value chain, from purchased goods to business travel.
2. Five menus, one working cycle
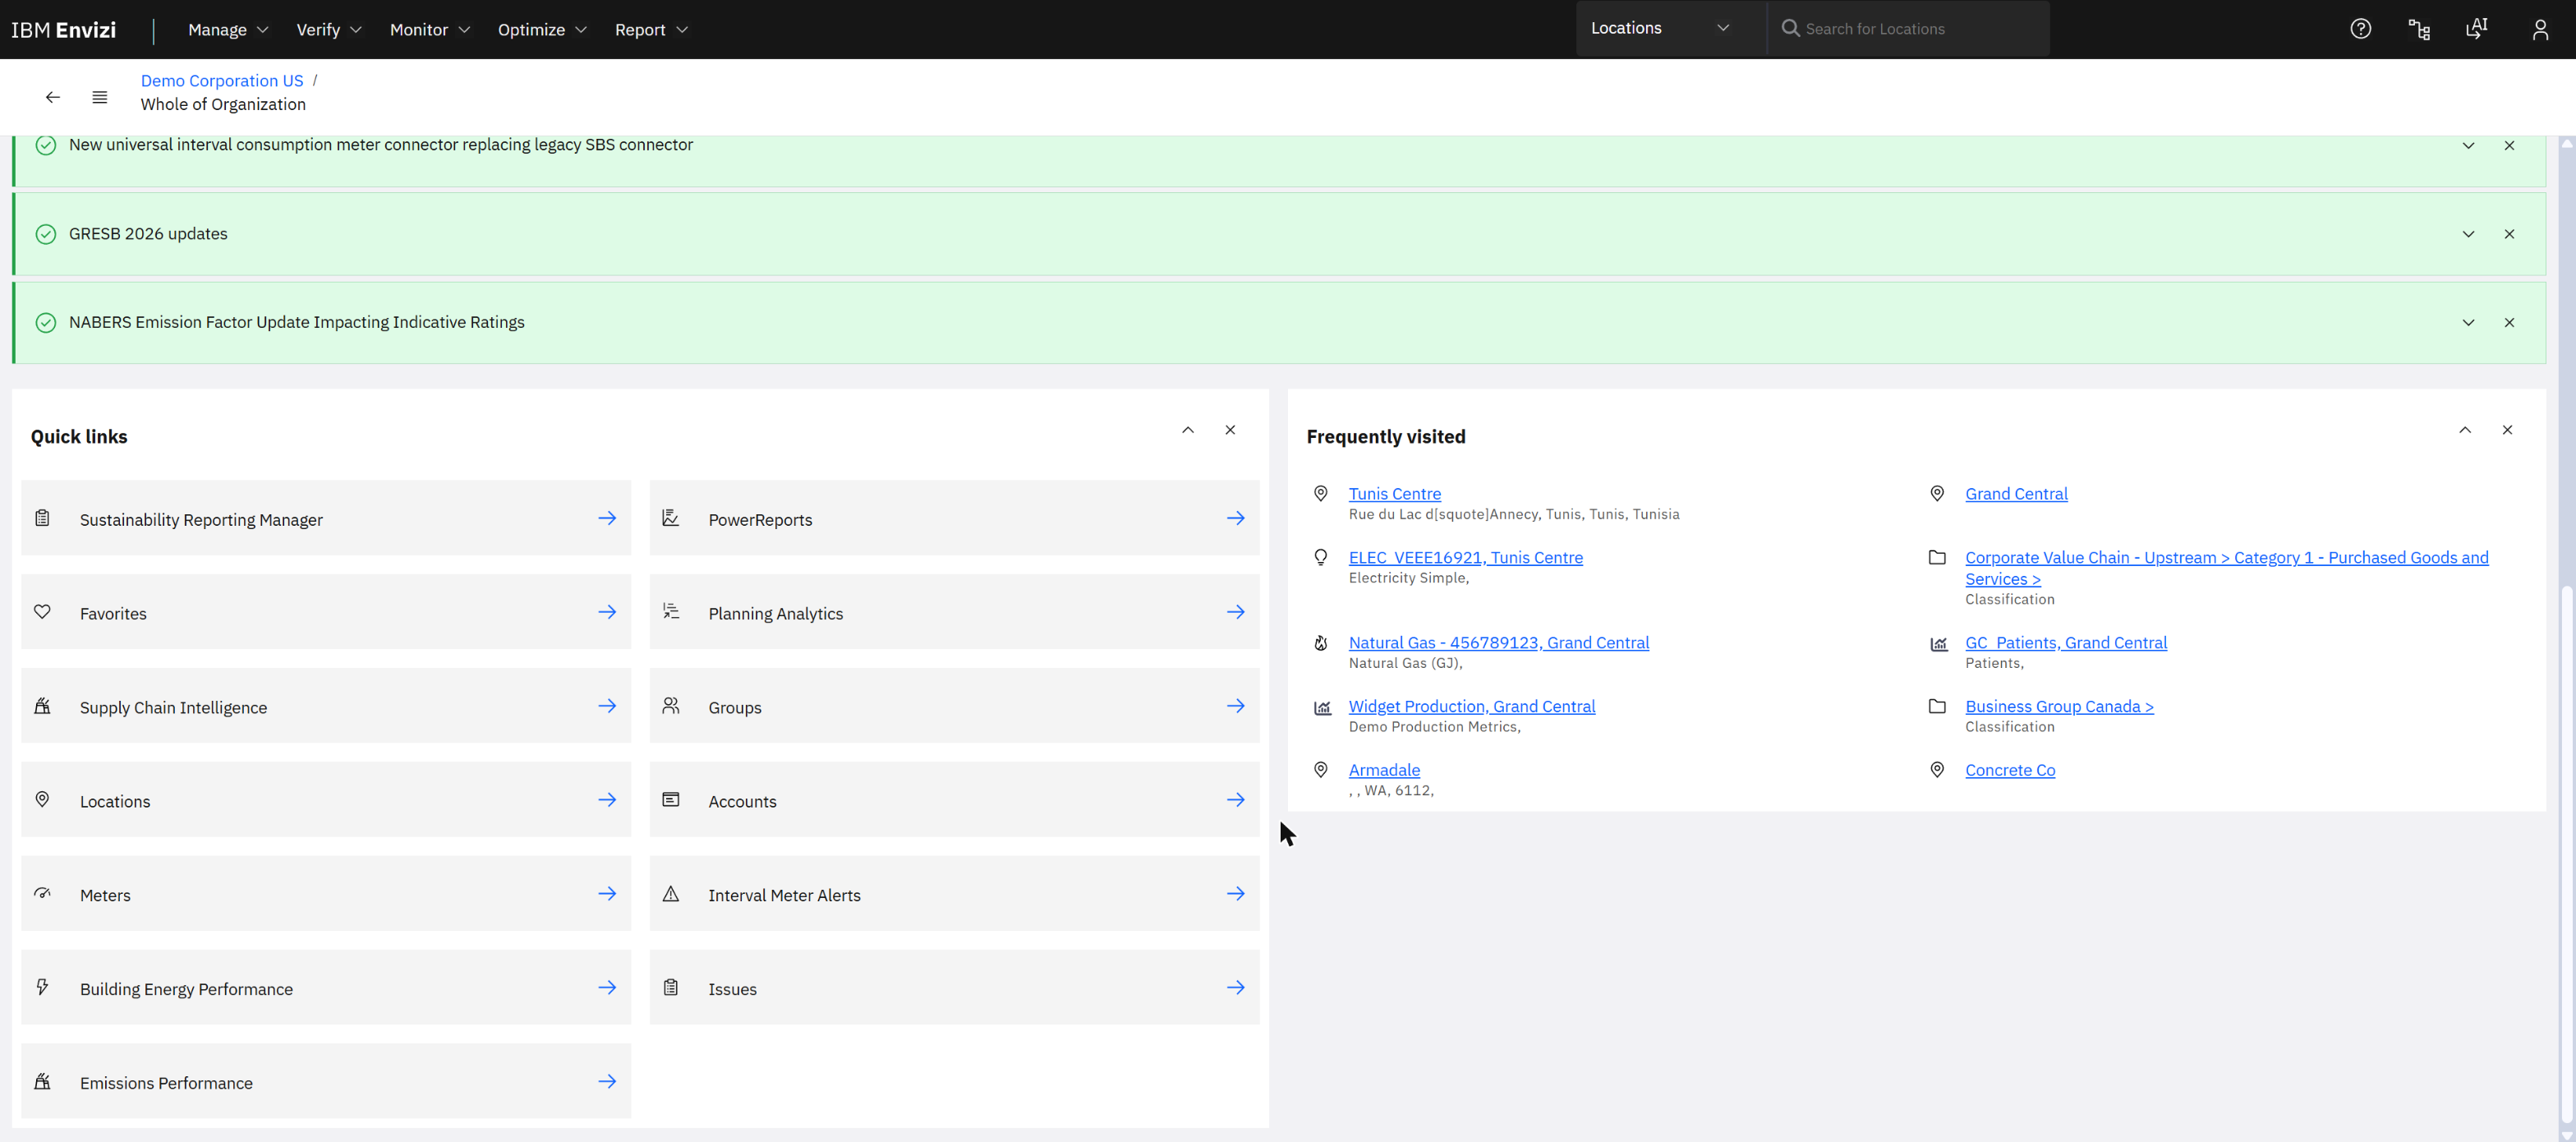
The home page: quick links to the main objects, and the places you visit most. The context (top left) is "Whole of Organization".
| Menu |
What it is for |
Examples on the demo system |
| Manage |
Set up and load |
Groups, Locations, Accounts, Meters; data health checks; targets and budgets; upload files |
| Verify |
Check the money |
Utility bill analytics for electricity, gas and water; budgets; bill checking |
| Monitor |
Watch performance |
Performance by scope, group or tag; emissions performance; benchmarks; meter alerts; issues |
| Optimize |
Improve |
Building energy performance; programs and actions |
| Report |
Publish |
PowerReports; scheduled reports; Sustainability Reporting Manager |
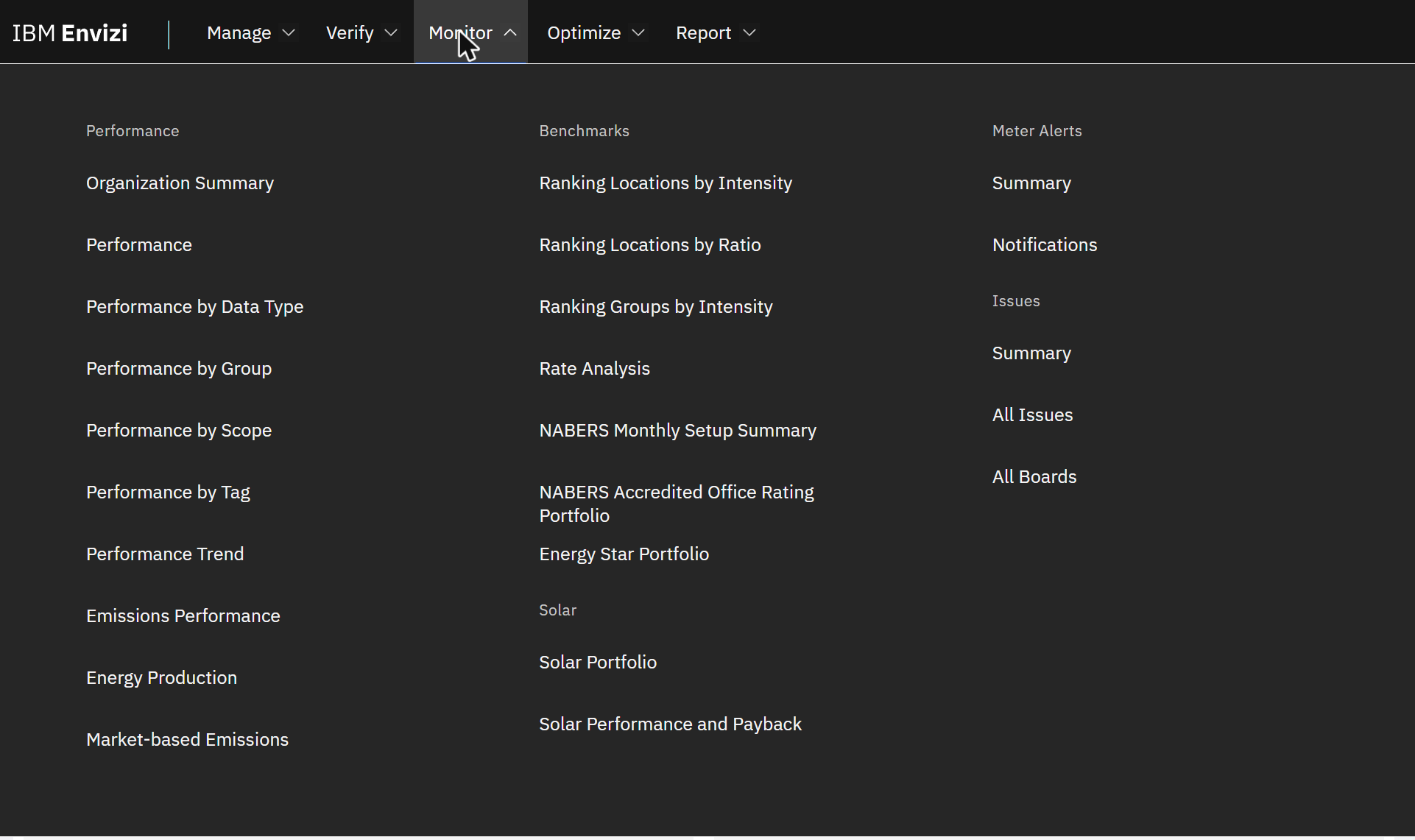
The Monitor menu. Each menu opens as a panel of grouped links.
3. The data model: group, location, account, record
| Object |
Meaning |
Demo example |
| Organisation |
The reporting entity |
Demo Corporation US |
| Group |
A folder of locations. A location can sit in many groups. |
Retail Group › Retail Properties |
| Location |
A place: a building, a plant, or a "virtual" place for corporate data |
Grand Central |
| Account |
One stream of data of one type at one location |
Natural Gas - 456789123 |
| Record |
One period of that stream: quantity, cost, dates |
A month of gas in GJ and USD |
Everything Envizi reports is a sum of records. The scope, the unit and the emission factor all follow from the account's data type, so choosing the right account style when you create an account is the decision that matters.
4. Use case 1: build the data foundation
4.1 Locations
Manage › Locations lists every place in the organisation, with its type and the region that decides its emission factors.
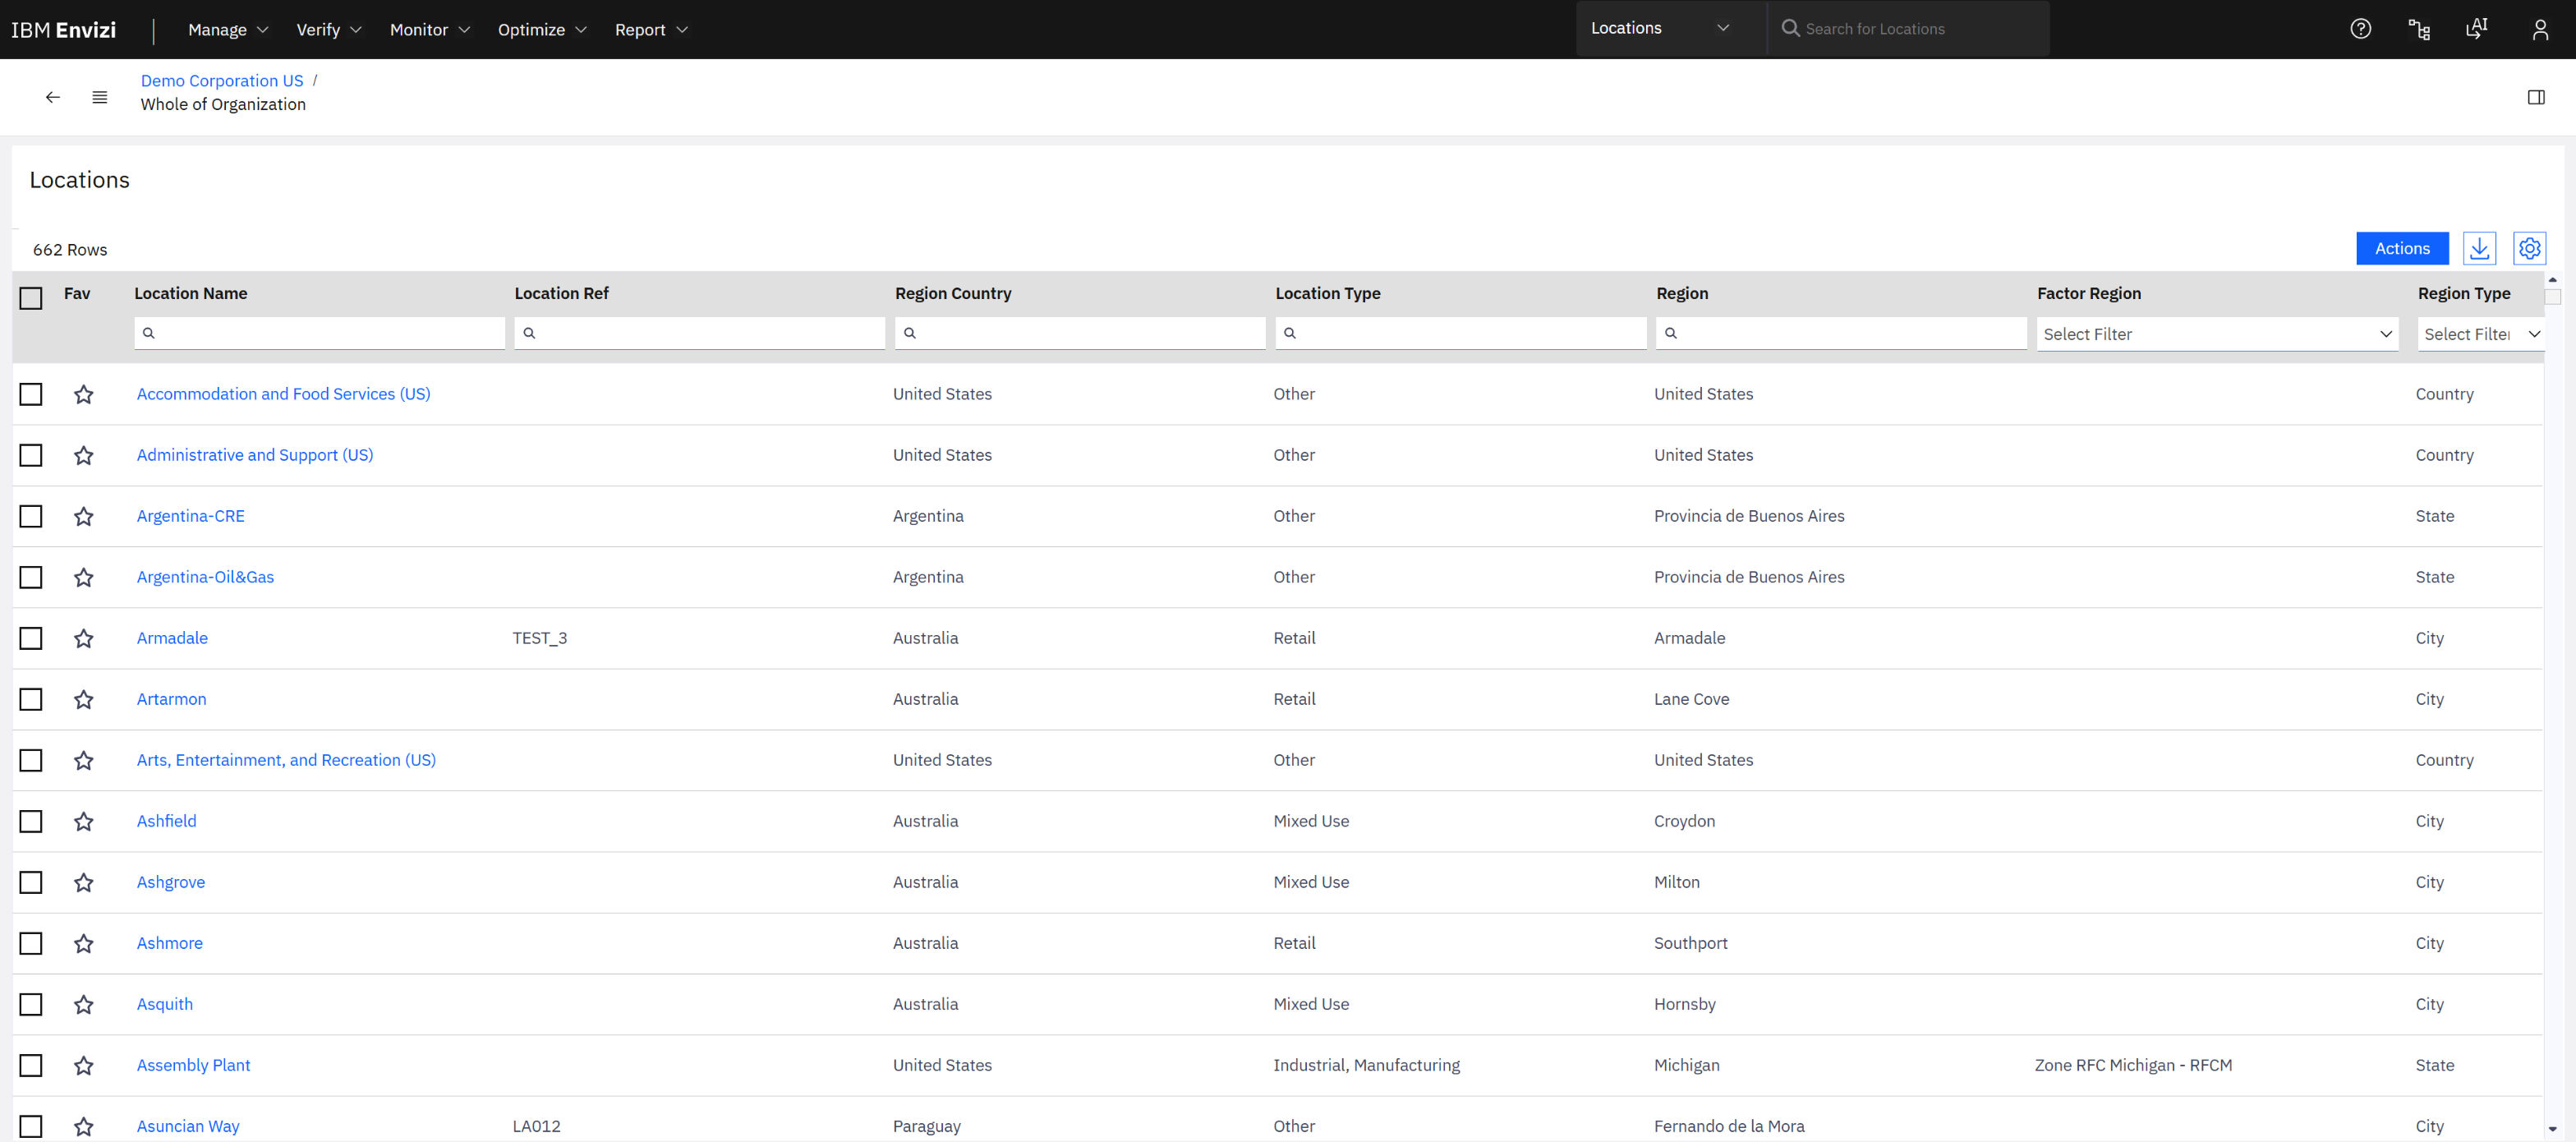
662 locations. Each column filters; the star adds a favourite.
4.2 One location: Grand Central
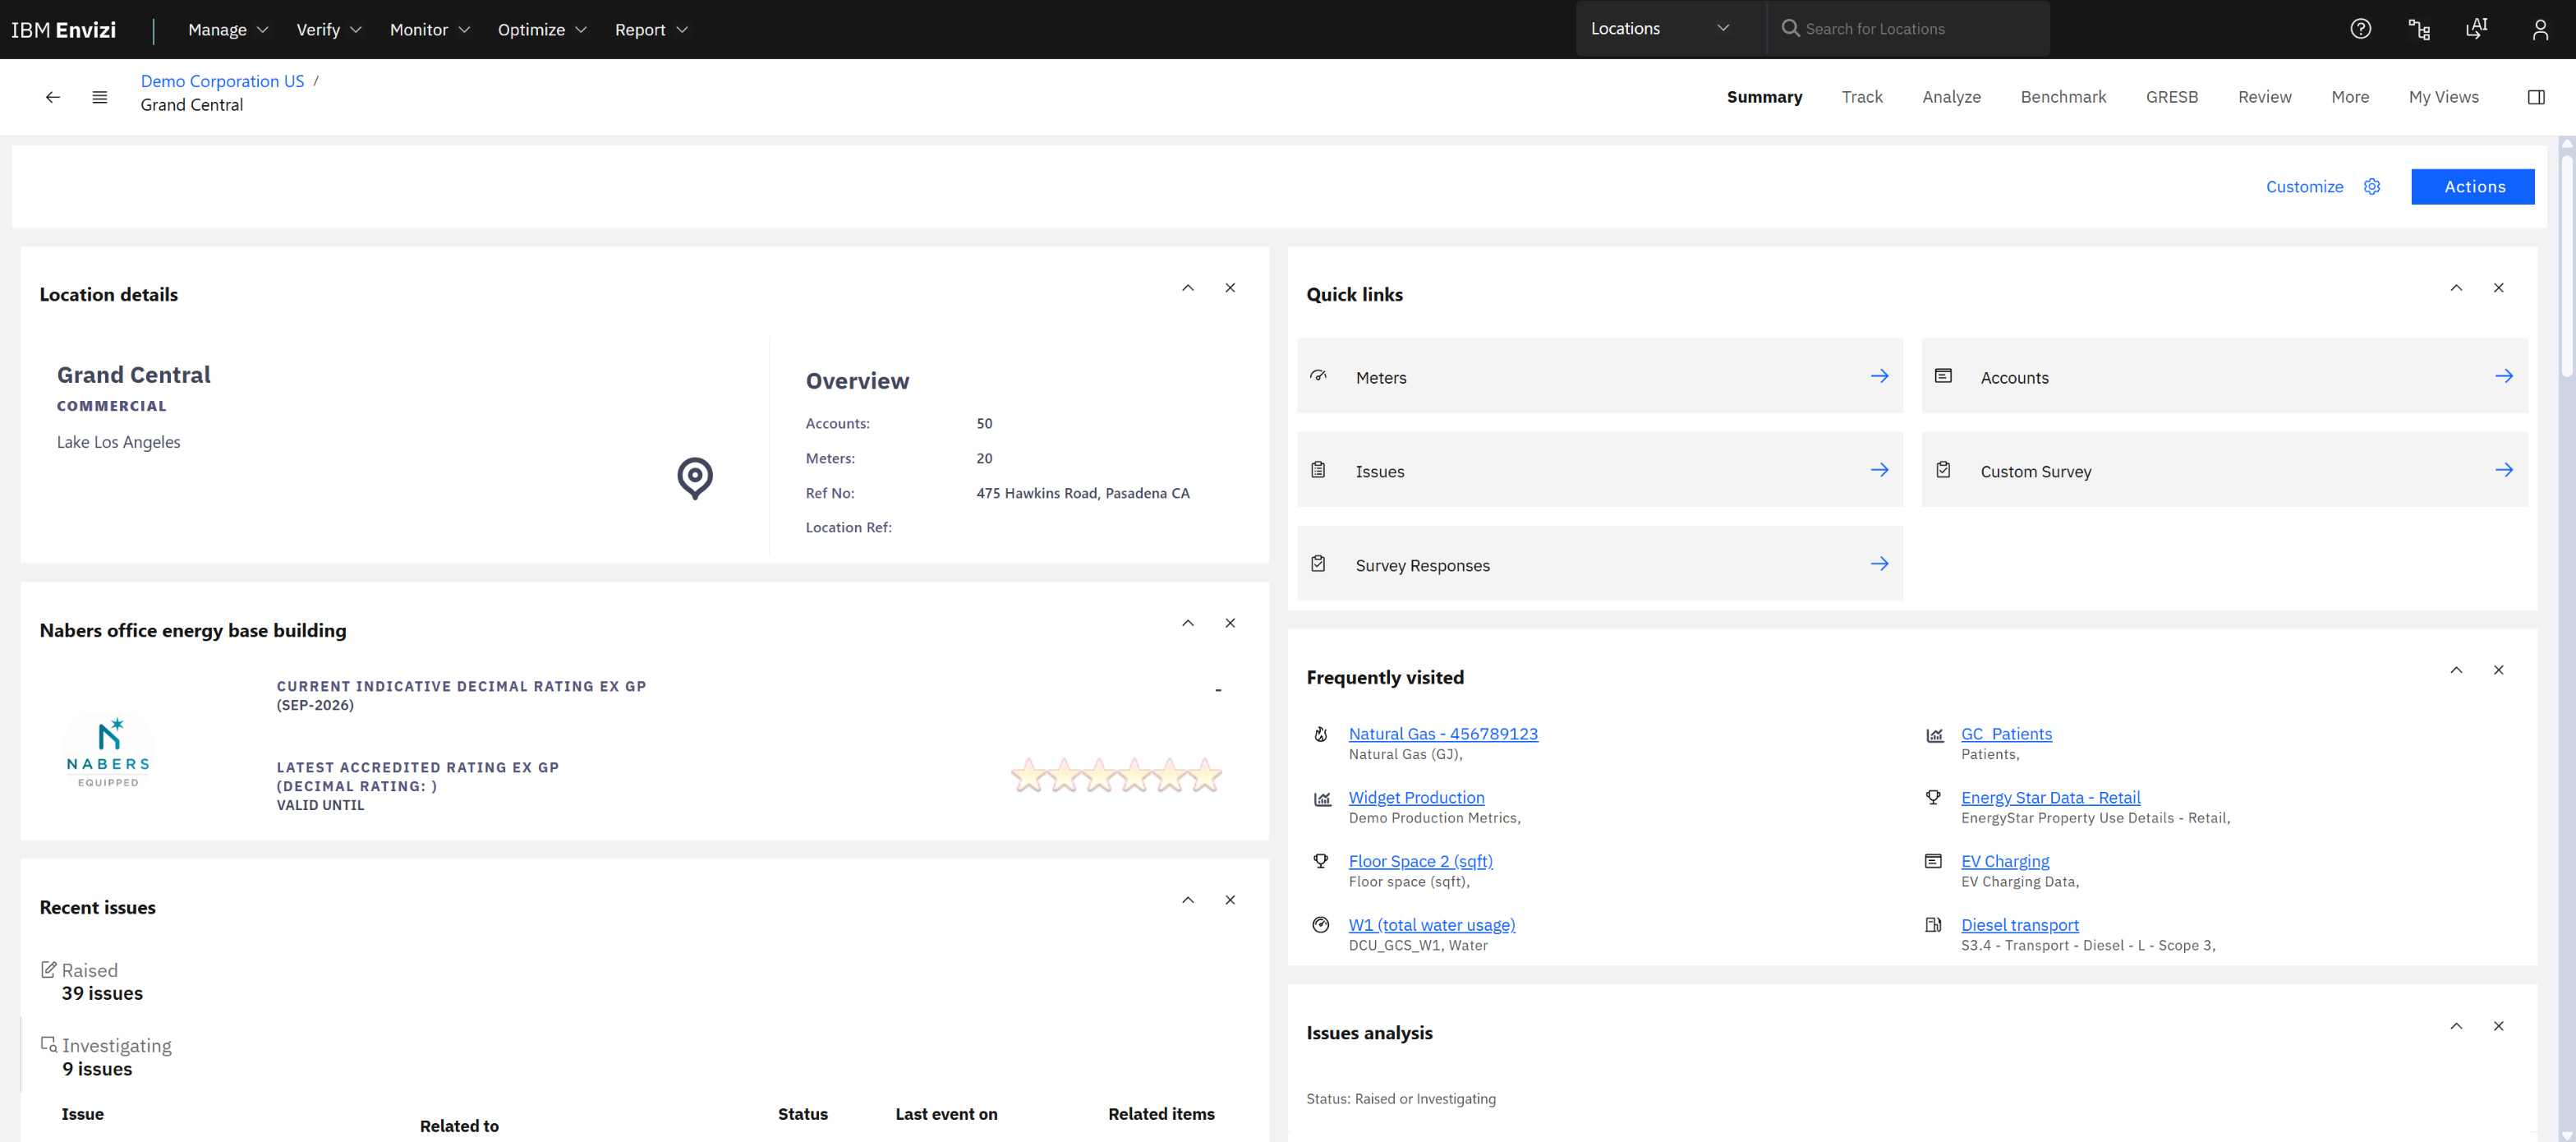
The location home page: 50 accounts, 20 meters, a building rating, recent issues, and the same Summary, Track, Analyze and Benchmark tabs you get at every level.
4.3 The hierarchy
The icon next to the back arrow opens the organisation tree. It is the fastest way to see how data is organised.
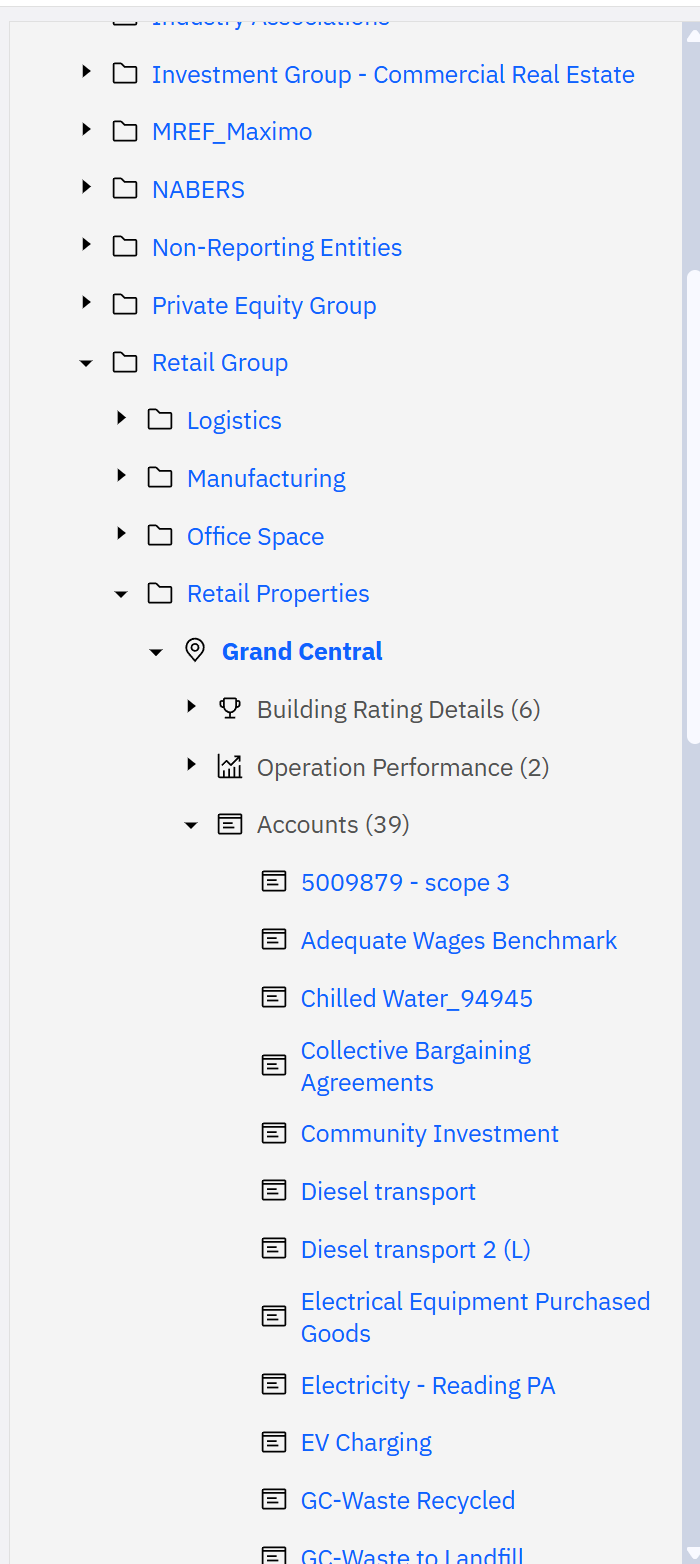
Retail Group › Retail Properties › Grand Central, with its 39 accounts opened: Scope 3 data, social metrics, chilled water, diesel, electricity, EV charging and waste sit side by side. Building ratings, meters and service points are the other branches.
The top of the same tree holds the classification groups. On the demo they include business groups, "Corporate Value Chain - Upstream" and "- Downstream" for Scope 3 data, corporate social metrics, and a group named "MREF_Maximo".
Not all data belongs to a building. Purchases, business travel and social metrics are held in accounts under corporate groups or virtual locations. That is how Scope 3 and social data live in the same model as a gas bill.
4.4 One account: the gas bill
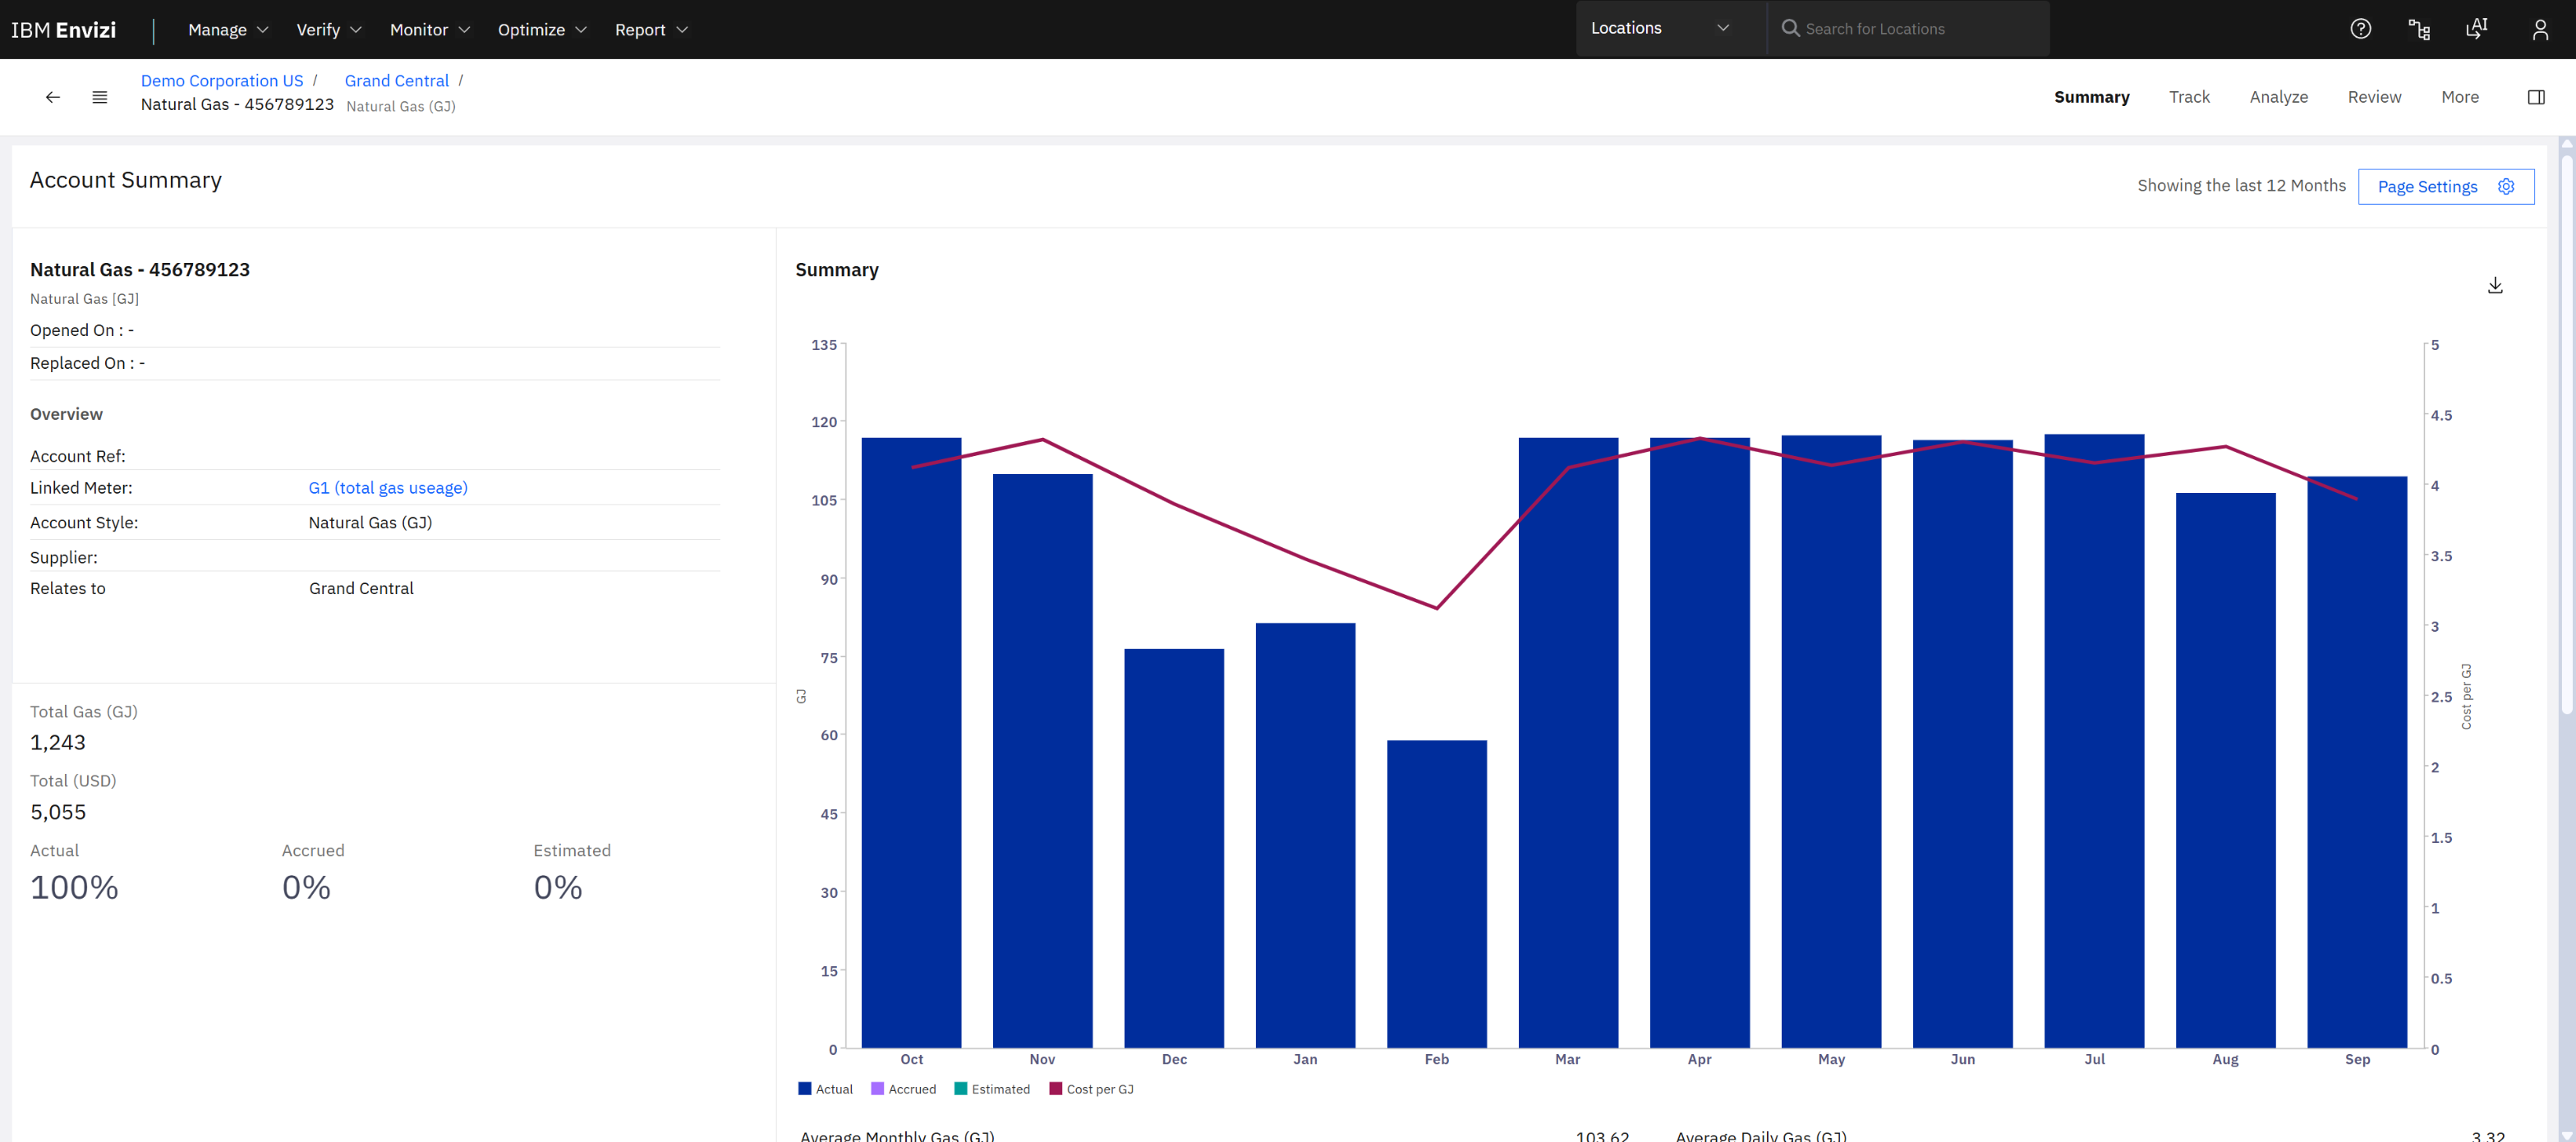
Natural Gas - 456789123 over the last 12 months: 1,243 GJ, 5,055 USD, 100% actual data. Bars are consumption; the line is cost per GJ.
Three things on this page are worth reading closely:
- Actual / Accrued / Estimated. When a bill is missing, Envizi can fill the gap with an accrual so the totals do not drop. The split tells you how much of a number is measured.
- Linked meter. The account is tied to a meter, "G1 (total gas usage)".
- Account style. "Natural Gas (GJ)" fixes the unit and the factor that will be applied.
Data reaches accounts in several ways: file uploads with templates (Manage › Data Files), connectors, and manual entry. Manage › Data Integrity then offers health checks by supplier, location and account.
5. Use case 2: report emissions
5.1 PowerReports
Report › PowerReports lists the Power BI reports embedded in Envizi: 60 on the demo, including one per CDP questionnaire year.
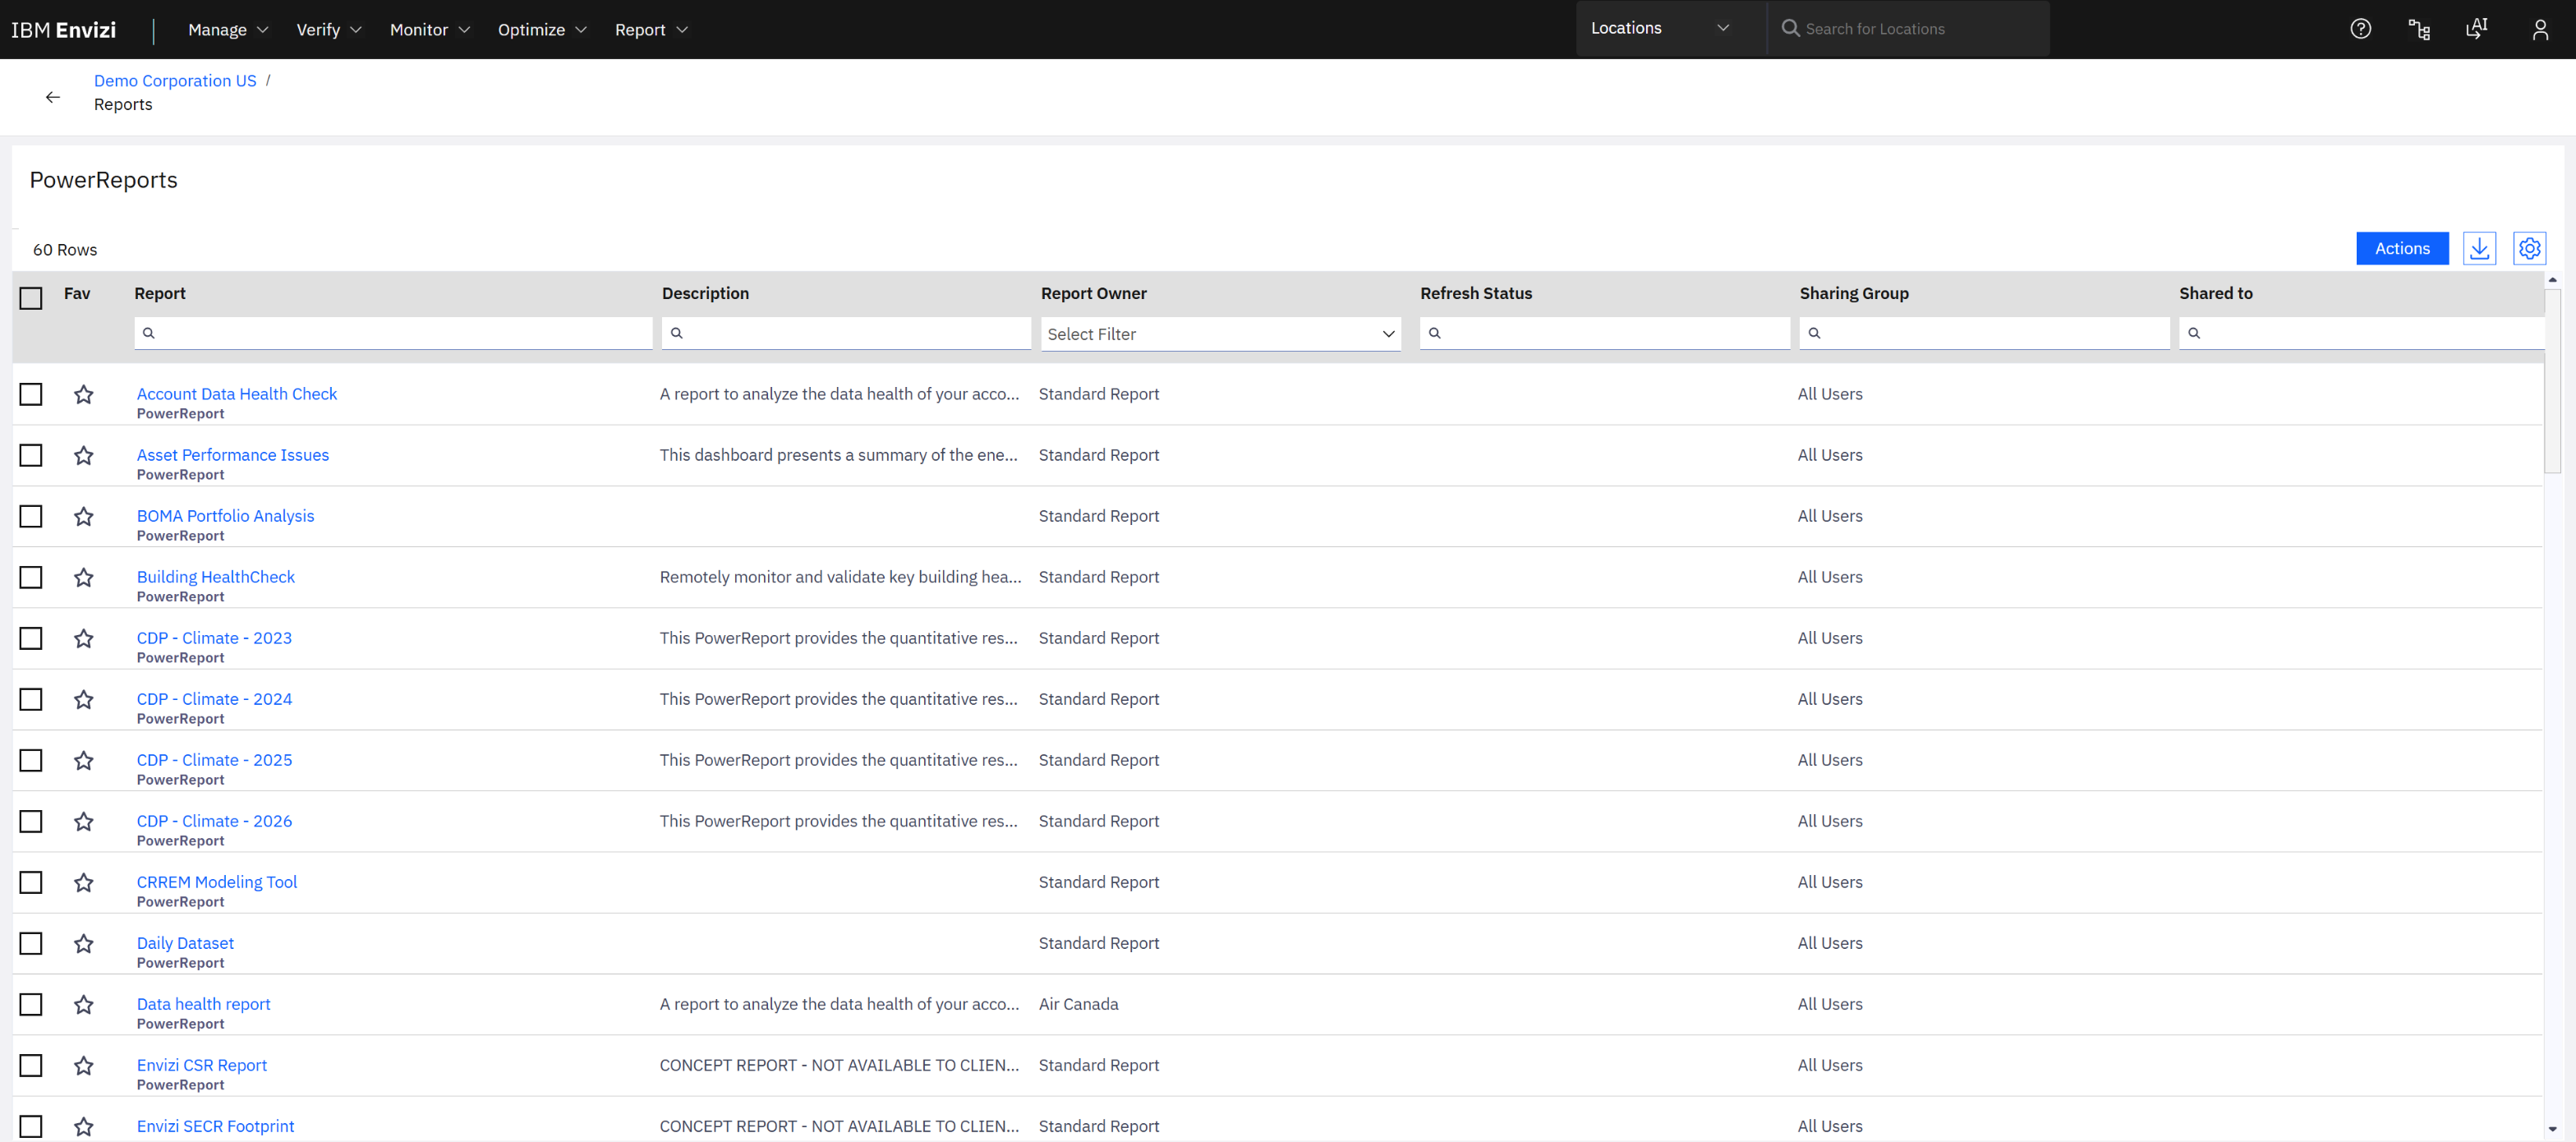
PowerReports. A report opens in its own browser tab.
5.2 The executive view
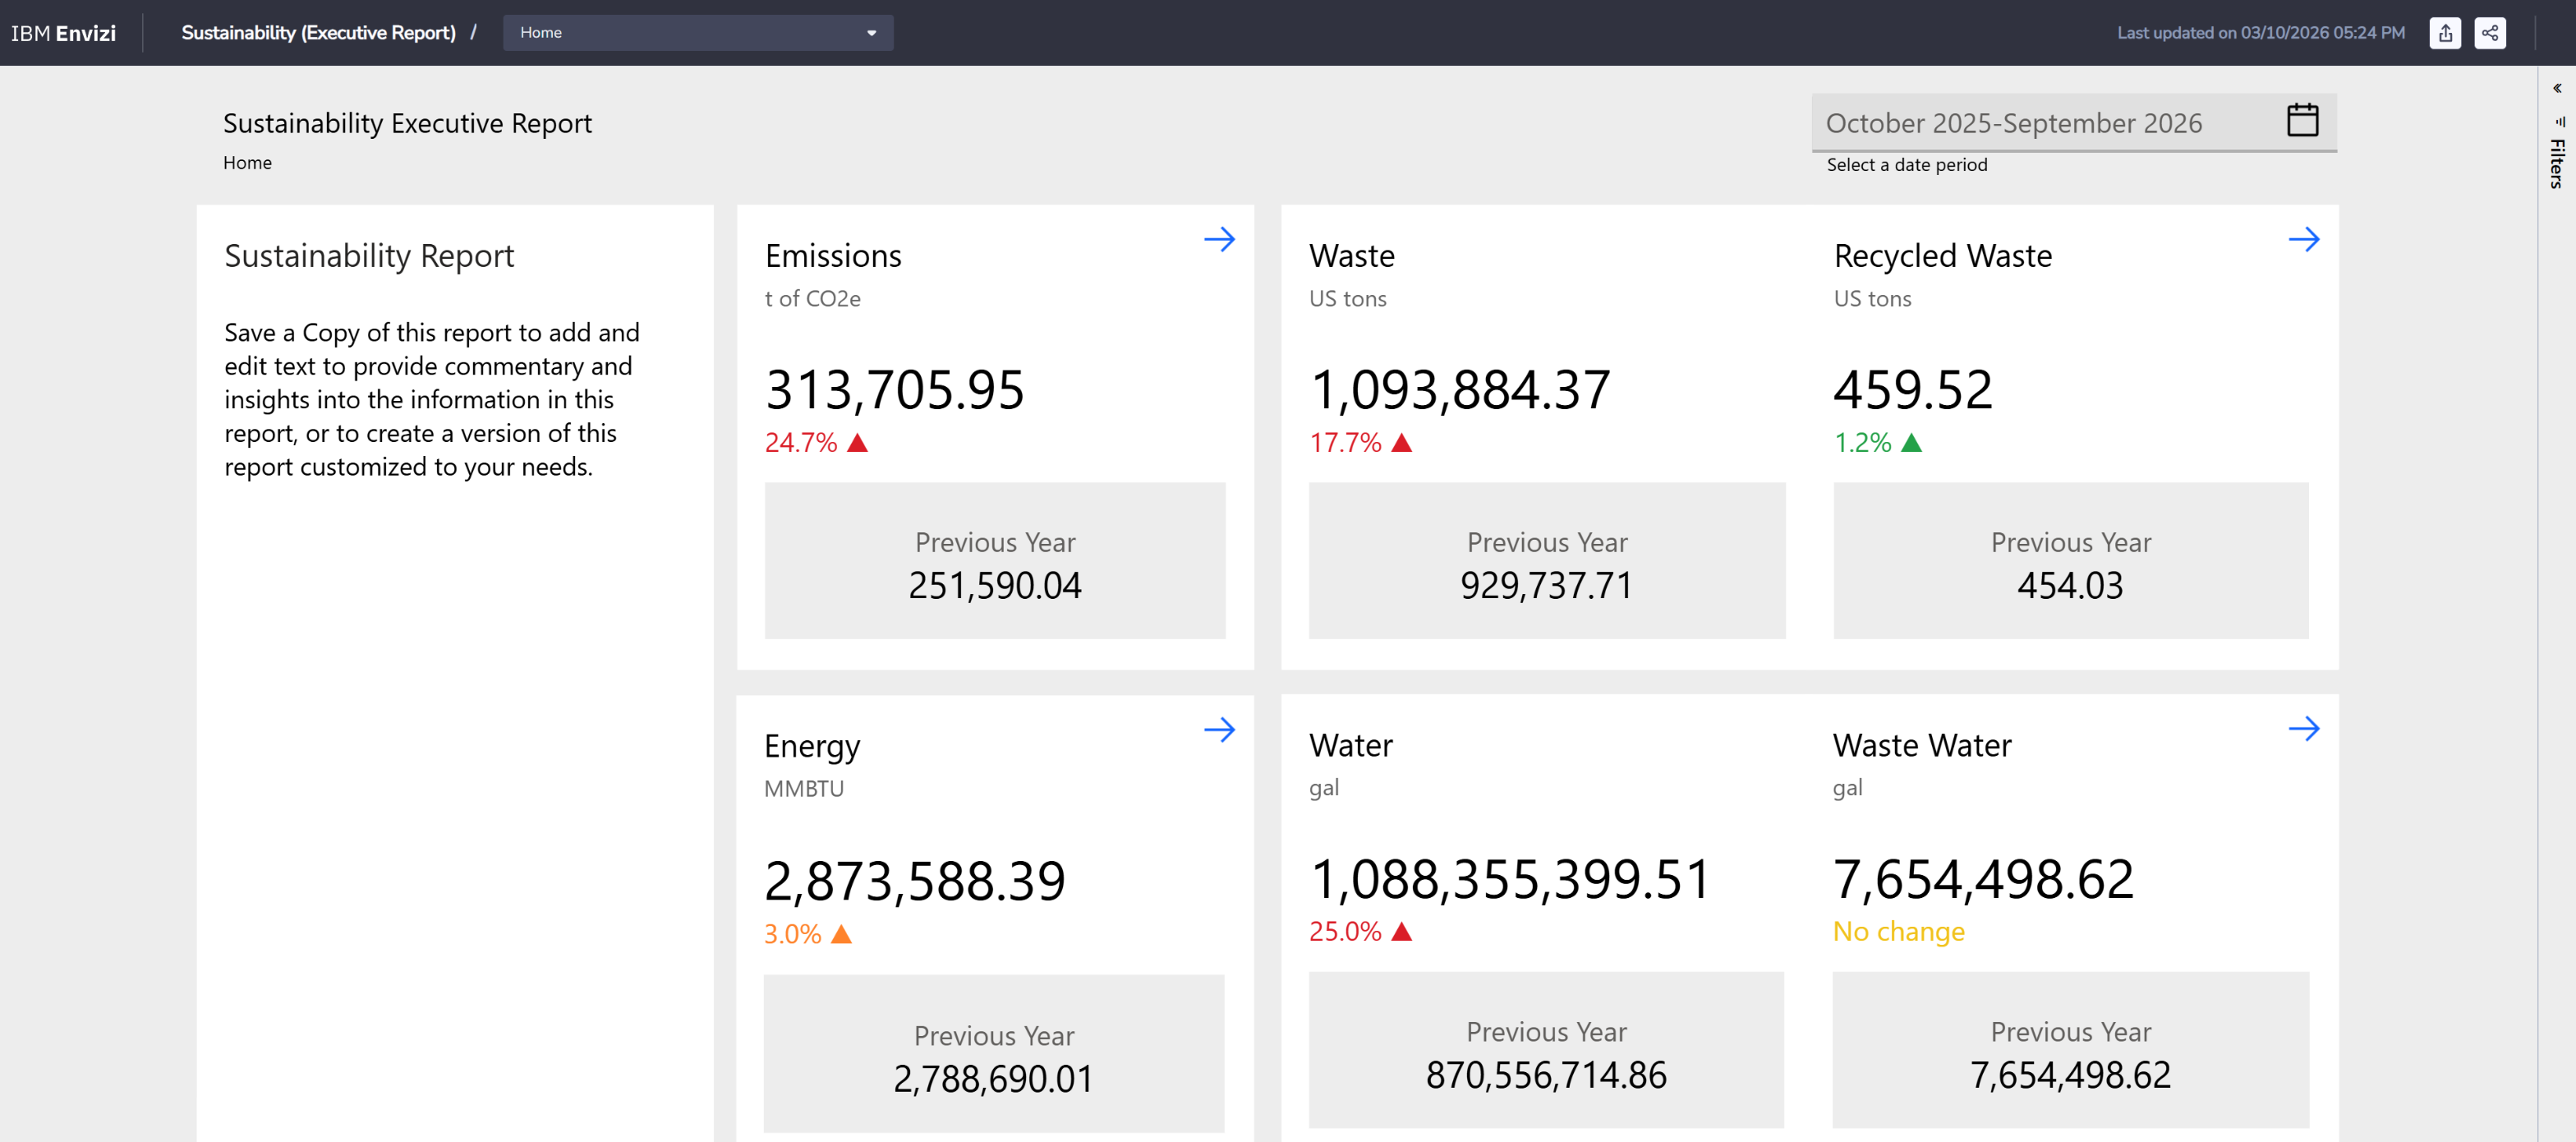
Sustainability (Executive Report), October 2025 to September 2026: emissions, energy, waste and water, each against the previous year.
The arrow on the Emissions tile opens the emissions dashboard:
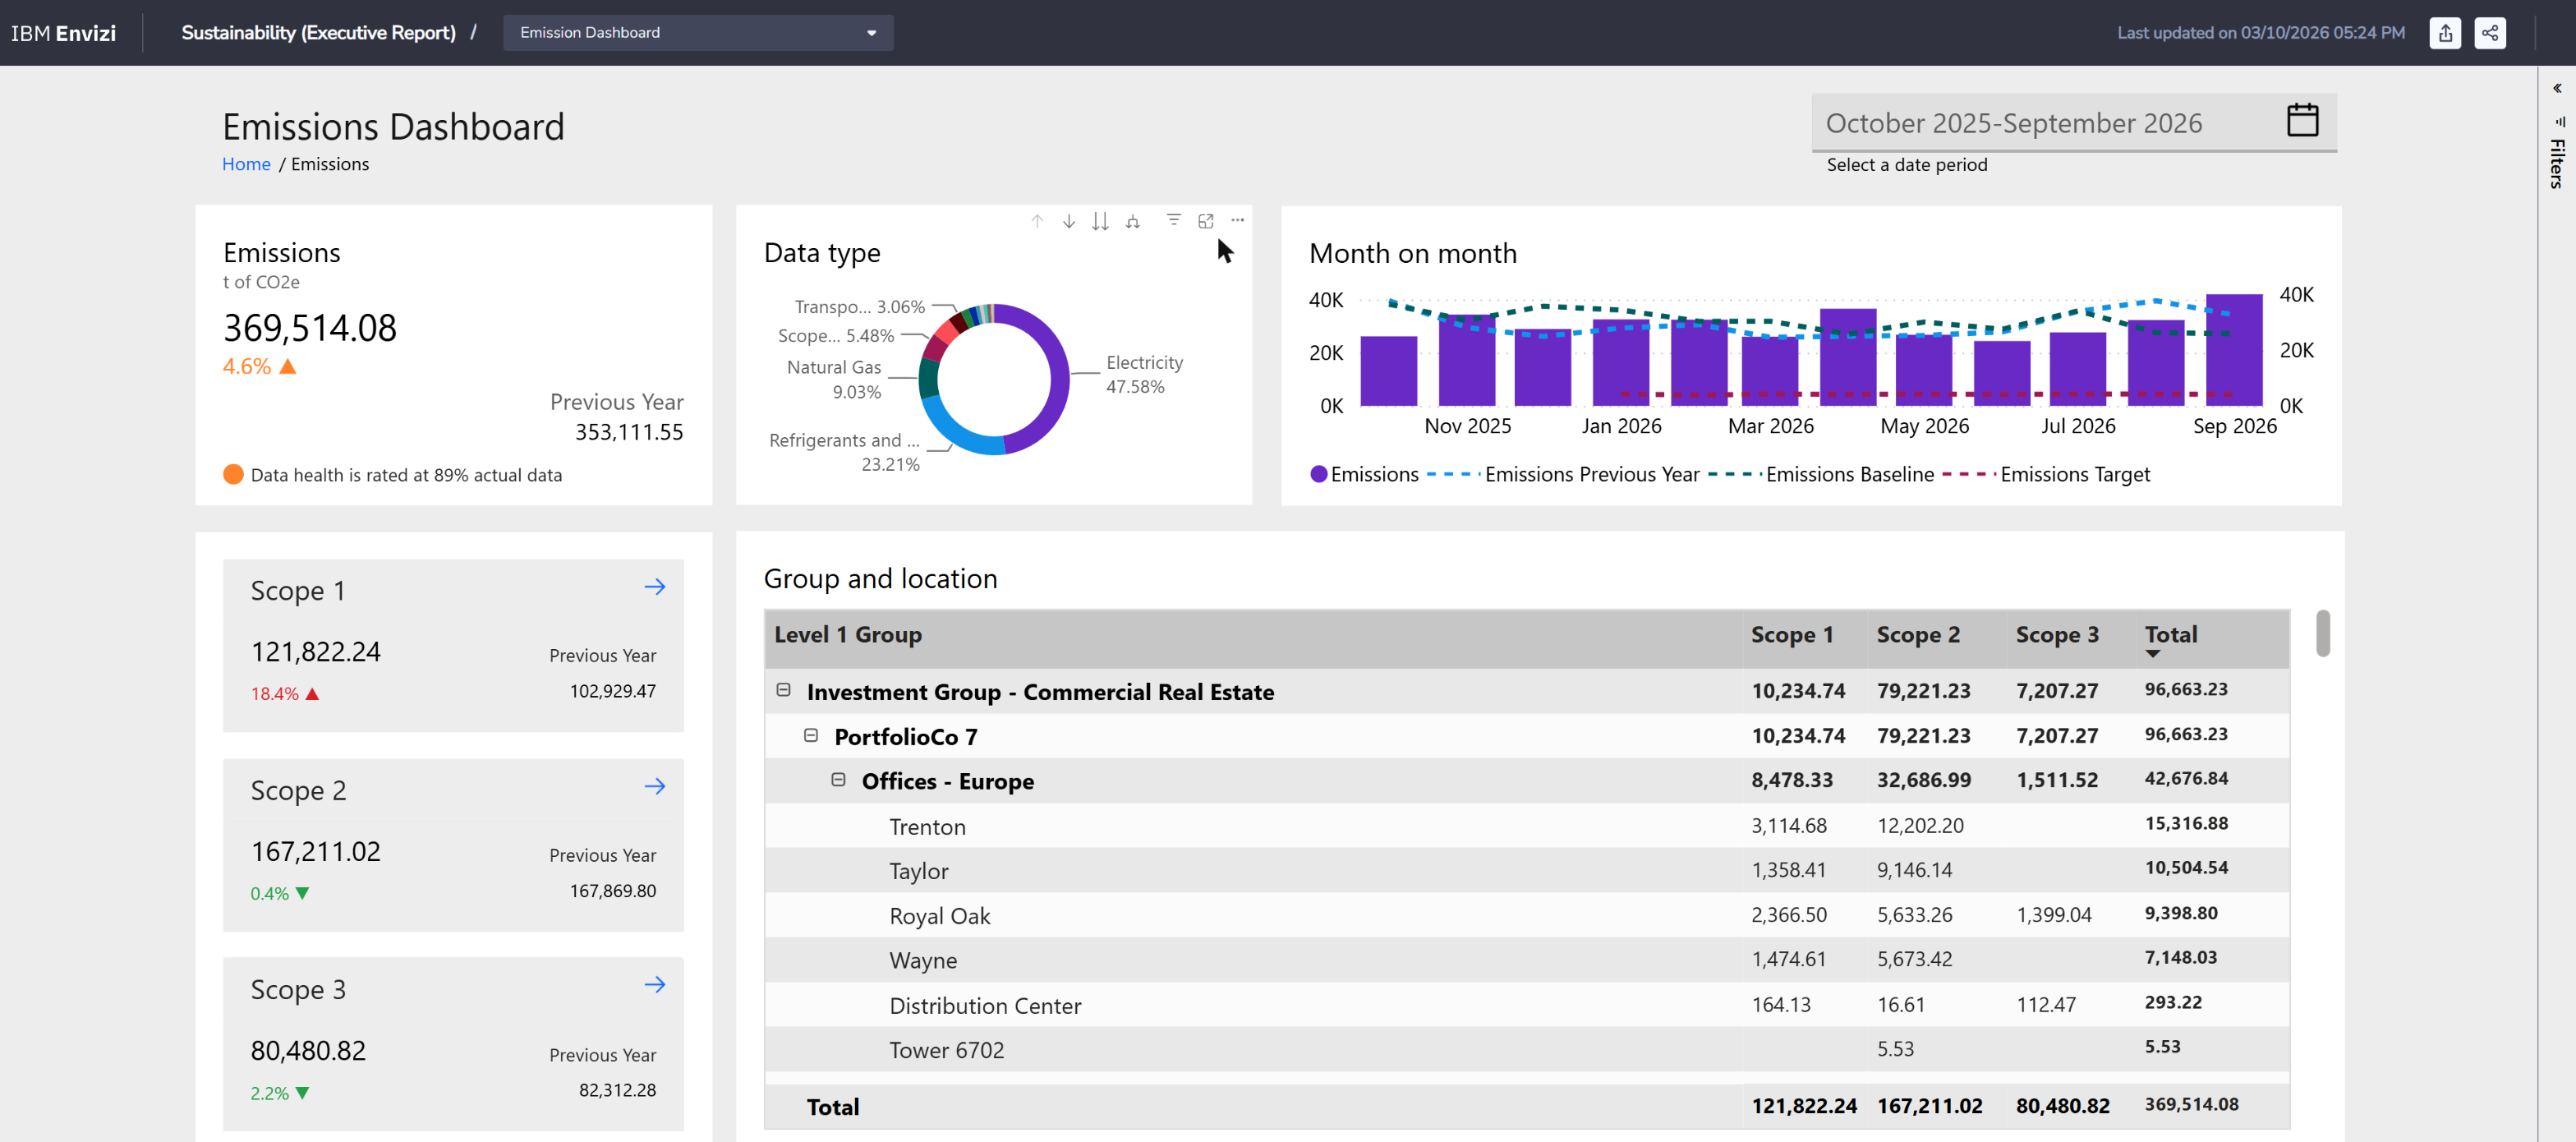
Scope 1: 121,822 t. Scope 2: 167,211 t. Scope 3: 80,481 t. The table drills from group to location; the note under the total says how much of the data is actual.
| Reading |
Value on the demo |
| Total on the emissions dashboard |
369,514 t CO2e, up 4.6% |
| Largest data type |
Electricity, 47.6% |
| Data health |
89% actual data |
| Largest group shown |
Investment Group - Commercial Real Estate, 96,663 t |
5.3 Scope 3
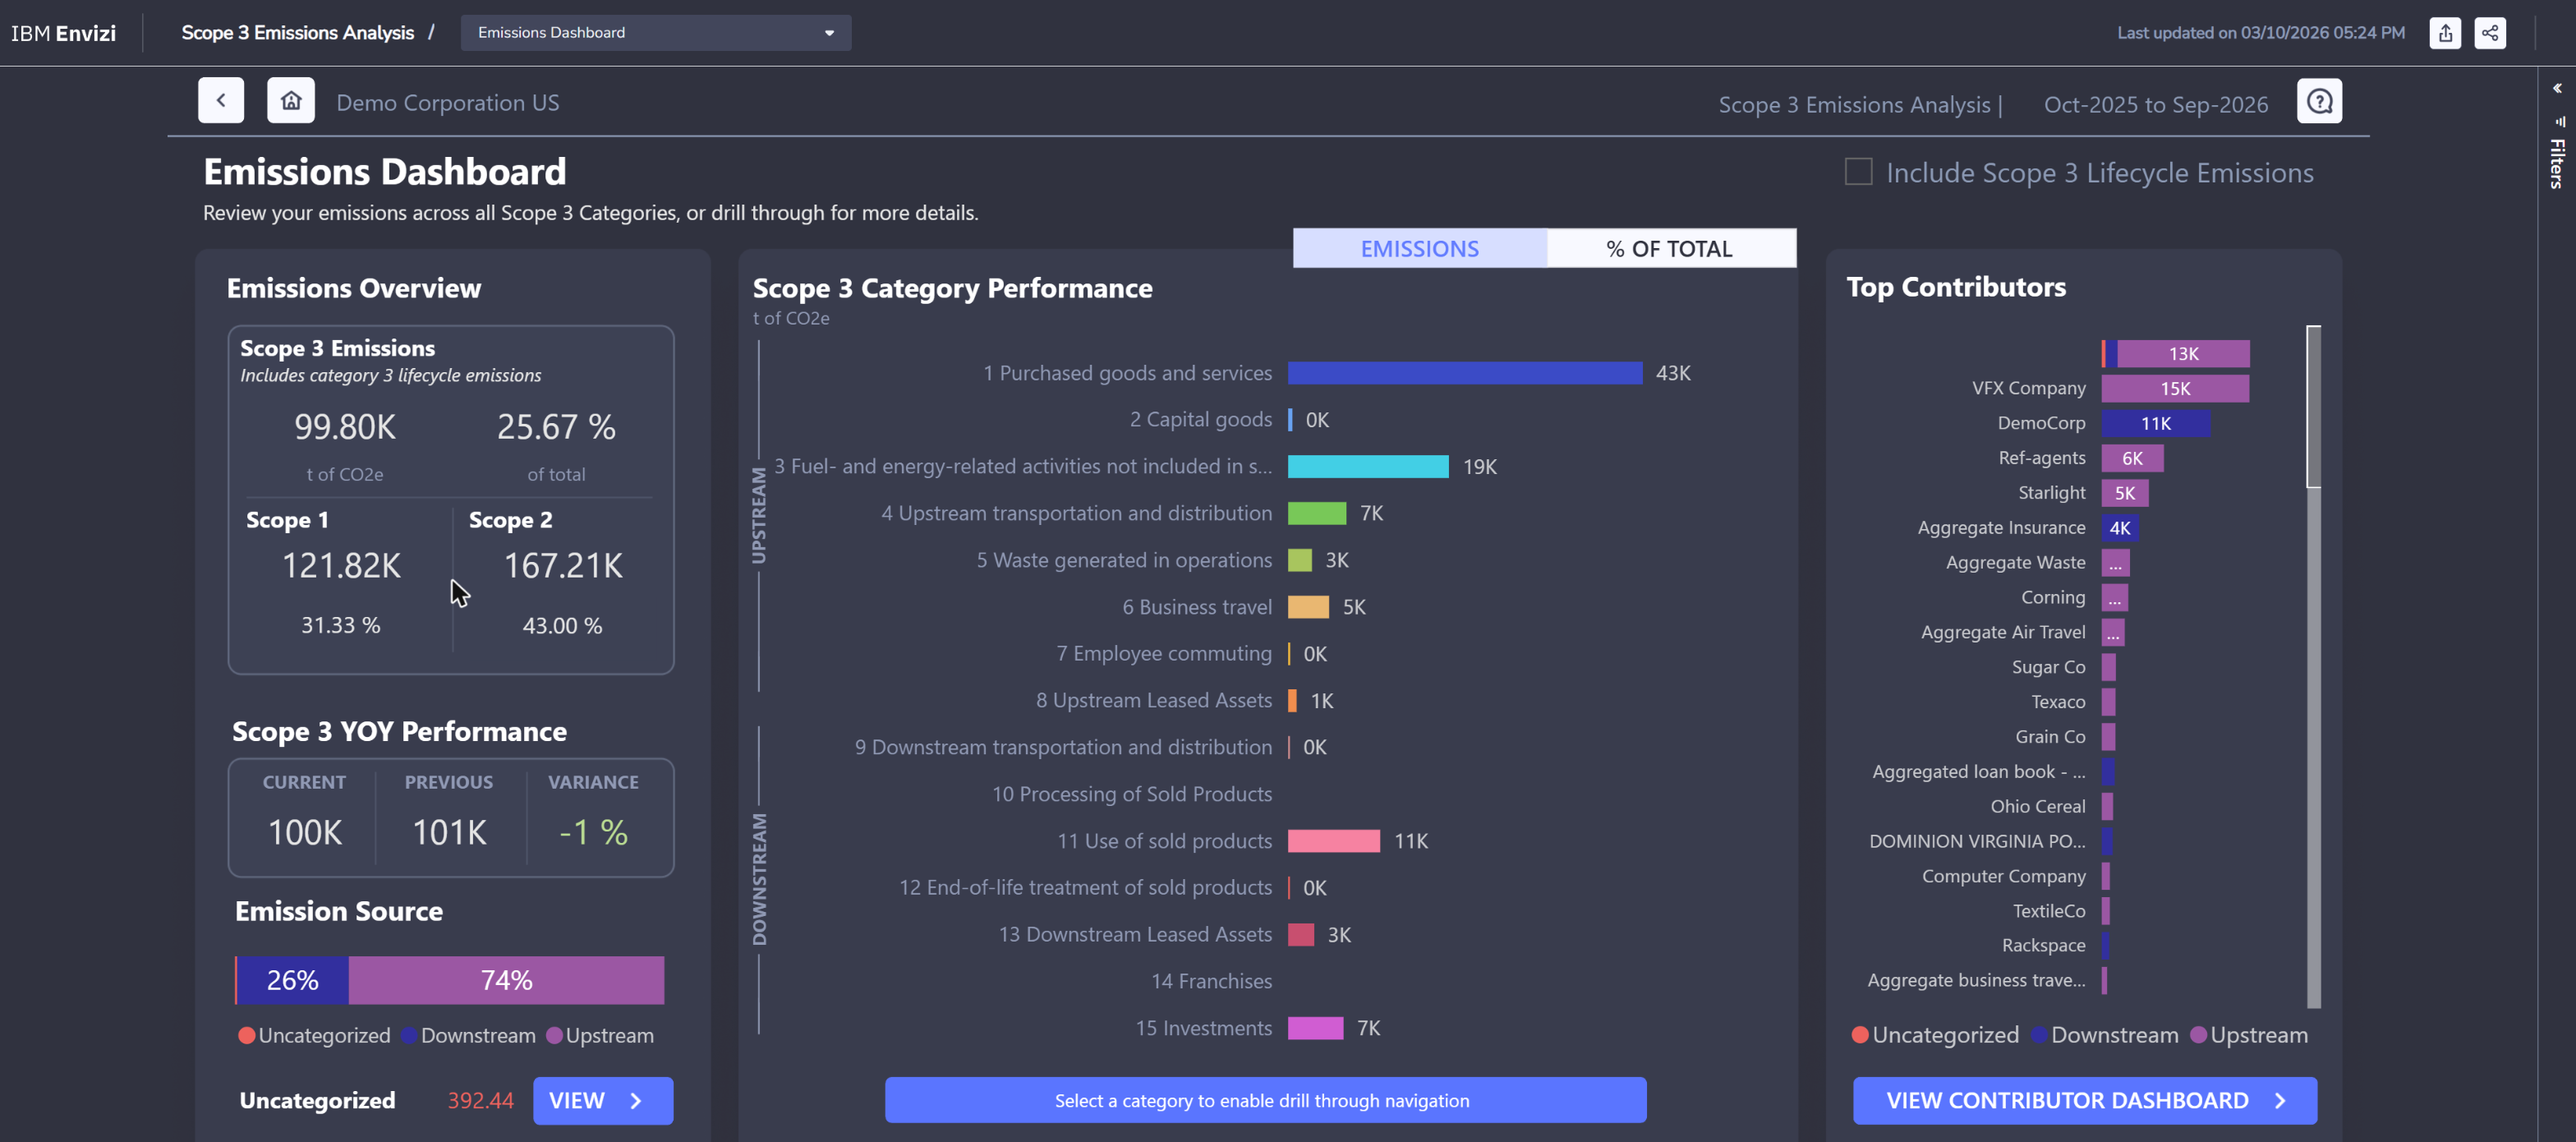
Scope 3 Emissions Analysis: 99.8 thousand tonnes, about a quarter of the total, split by the standard Scope 3 categories. Purchased goods and services leads with 43 thousand. This report includes category 3 lifecycle emissions, which is why its Scope 3 total is higher than the 80,481 t on the dashboard above.
Scope 3 is where most organisations start with spend data (dollars multiplied by an industry factor) and move towards supplier- and product-specific figures for the categories that matter most. The same report has pages for the accuracy of the calculation method and for data health, so you can say how good the number is as well as how big.
5.4 Performance against last year
Monitor › Emissions Performance is not a Power BI report. It is a native page, and it works at any level of the hierarchy.
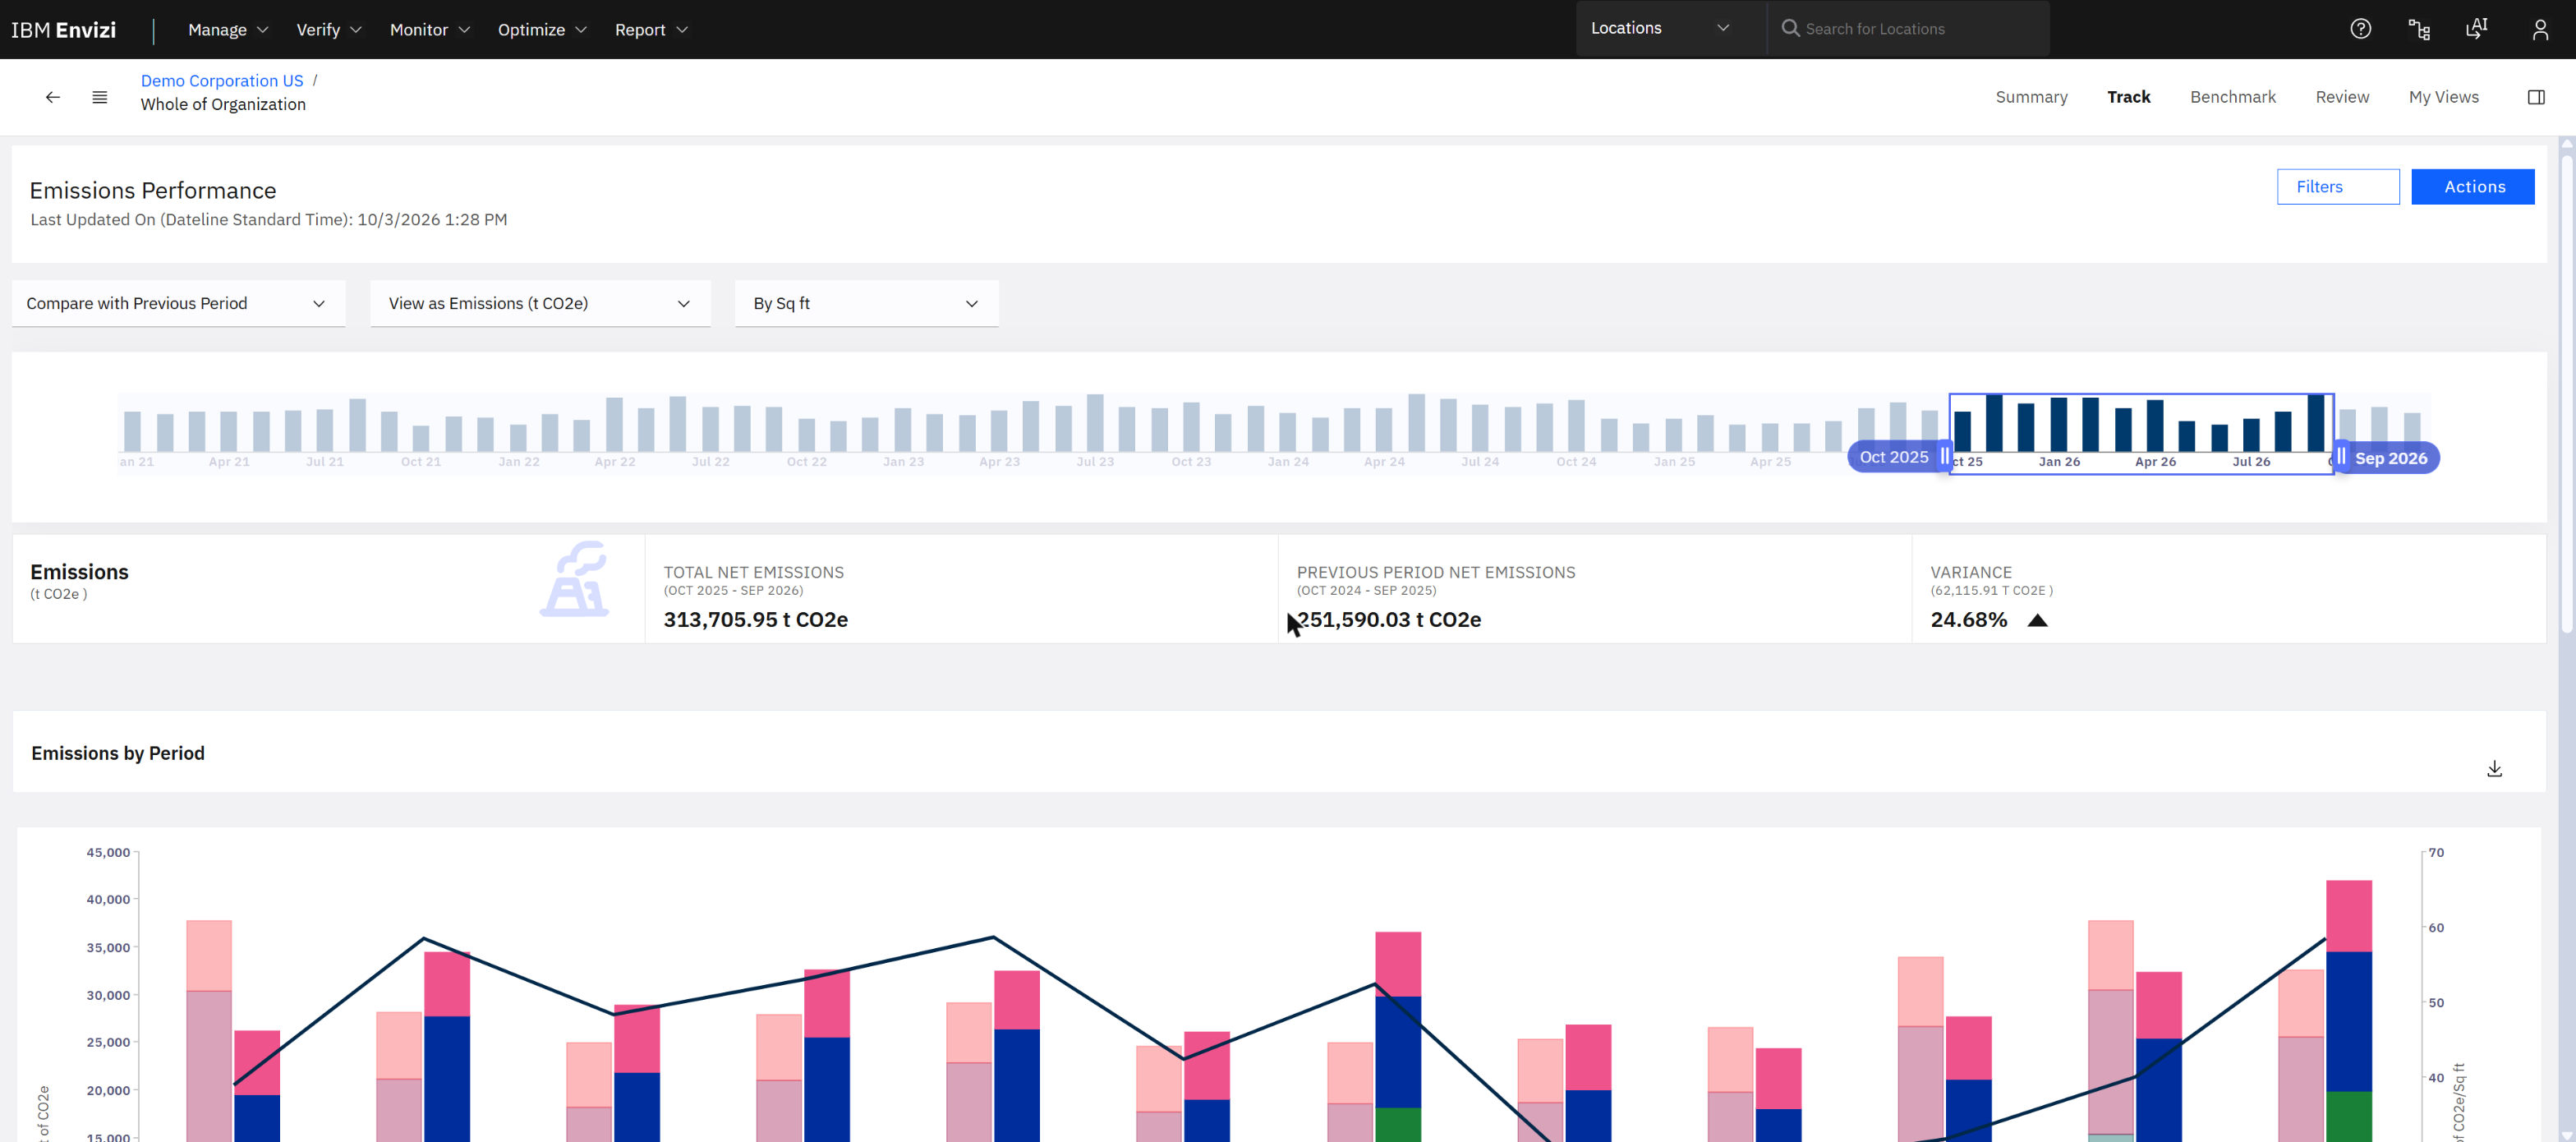
Total net emissions 313,706 t CO2e against 251,590 t for the previous period: up 24.68%. The drop-downs switch the comparison to a baseline or a target.
Two totals on two screens. This page reports net emissions of 313,706 t; the emissions dashboard above shows 369,514 t. Before you quote a figure, check what each page includes: net or gross, which scopes, which period. I did not reconcile the two on the demo.
6. Use case 3: answer a disclosure
Report › Sustainability Reporting Manager opens in its own tab. A disclosure is a project: a set of questions taken from one or more frameworks, each with an assignee, a reviewer, a status and due dates.
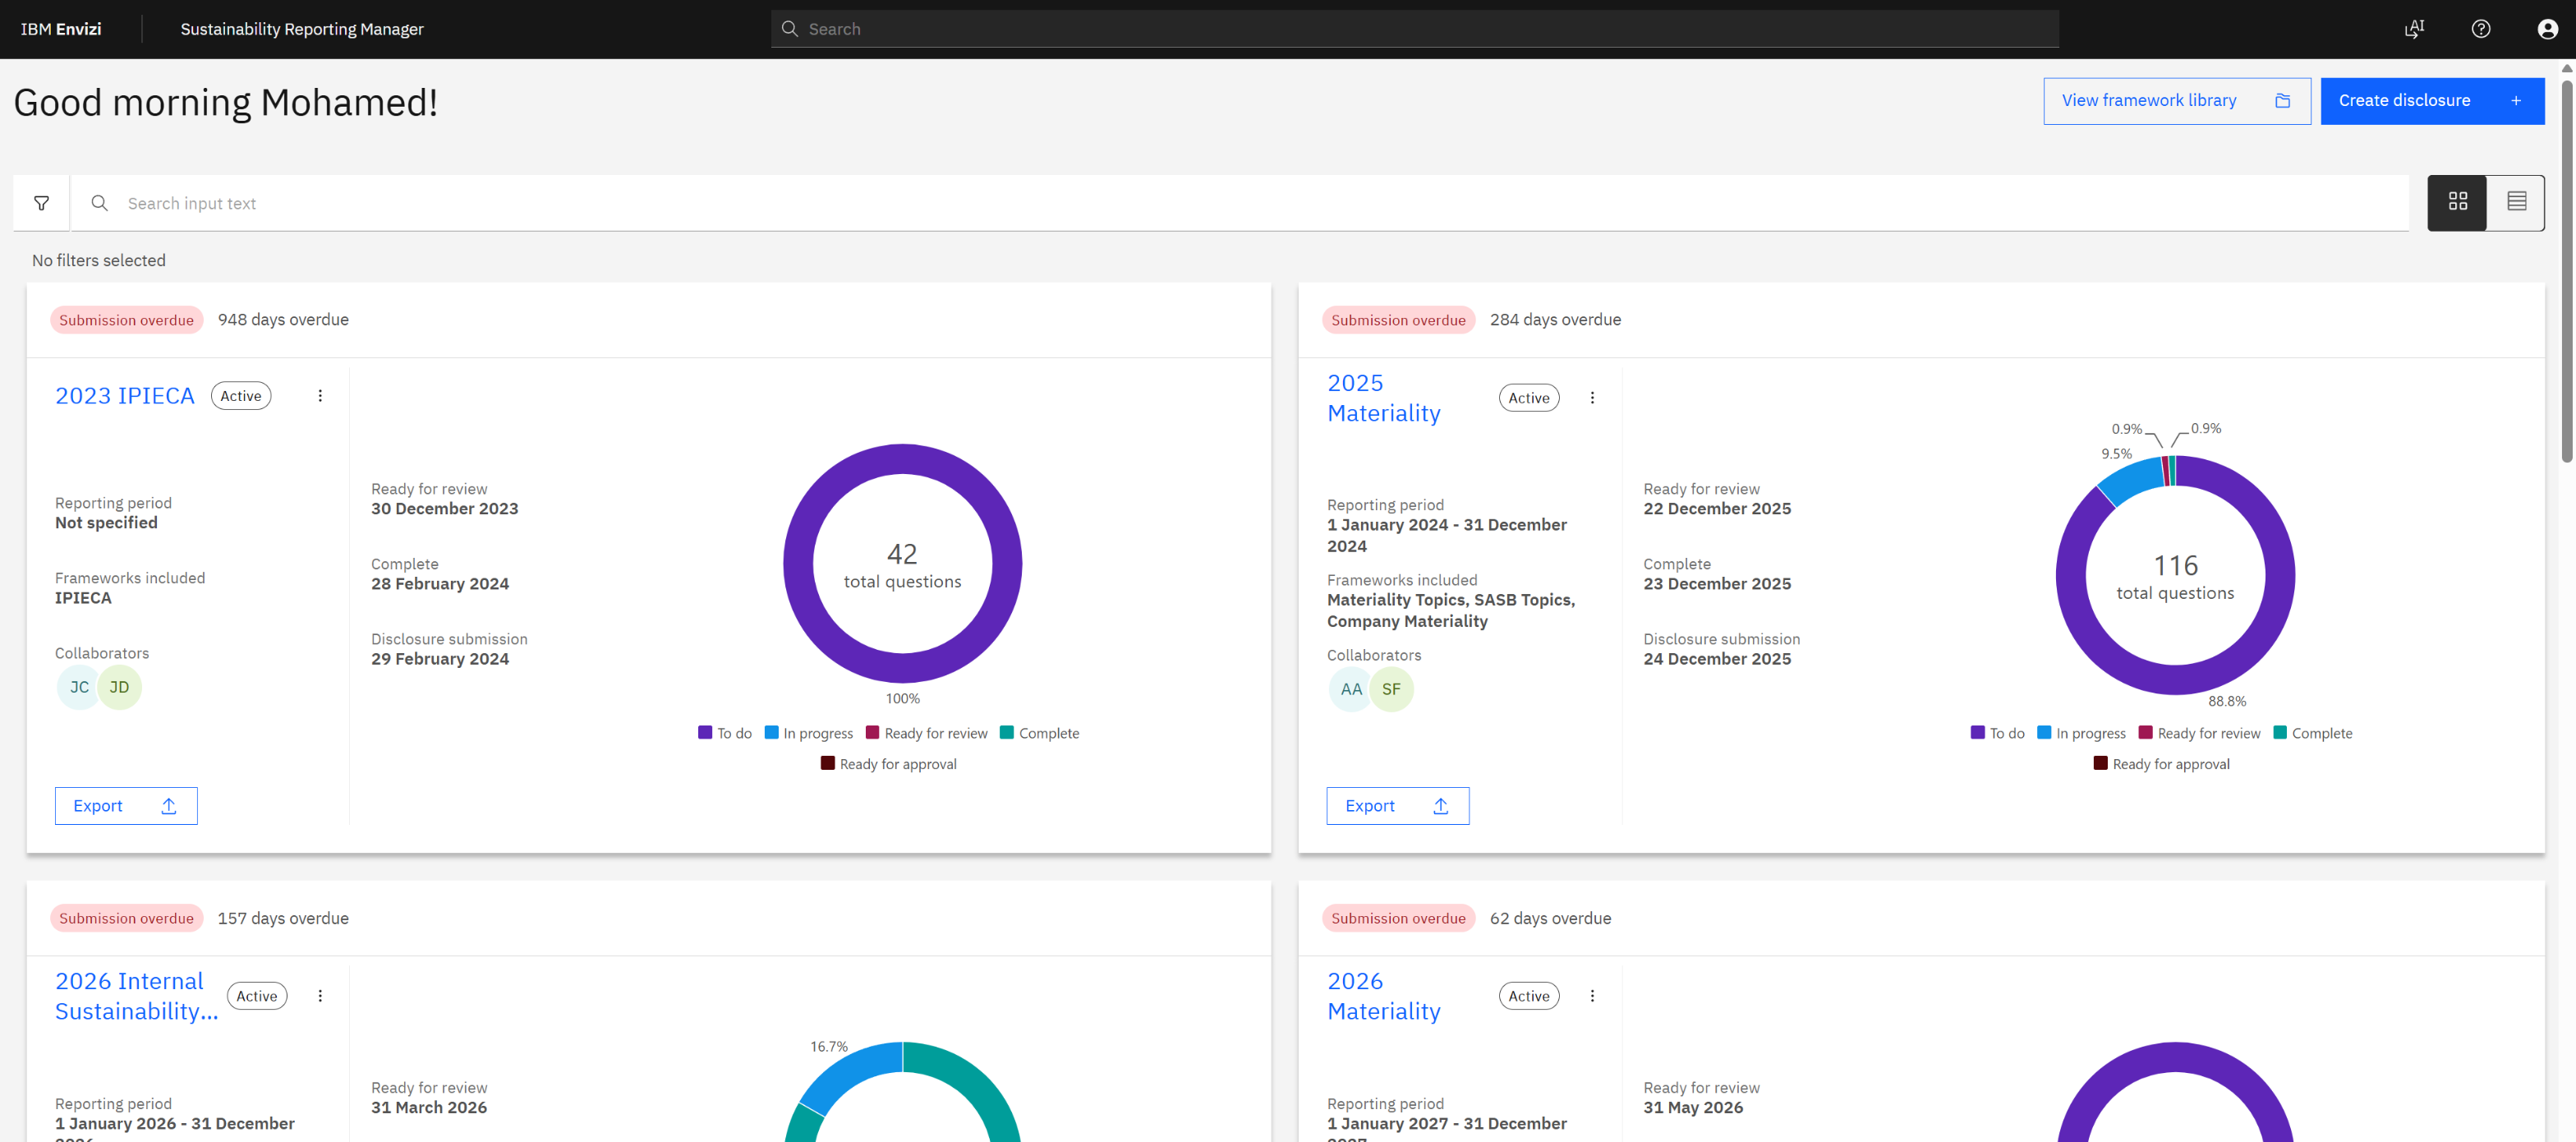
Disclosures as cards: frameworks included, collaborators, the three due dates, and a ring showing how many questions are to do, in progress or complete.
The frameworks used across the demo disclosures: IPIECA, SASB, TCFD, ESRS, GRI, ASRS S1 and S2, IFRS S2 (ISSB), and materiality topics. A framework library lets you pick questions; "Create disclosure" starts a new project.
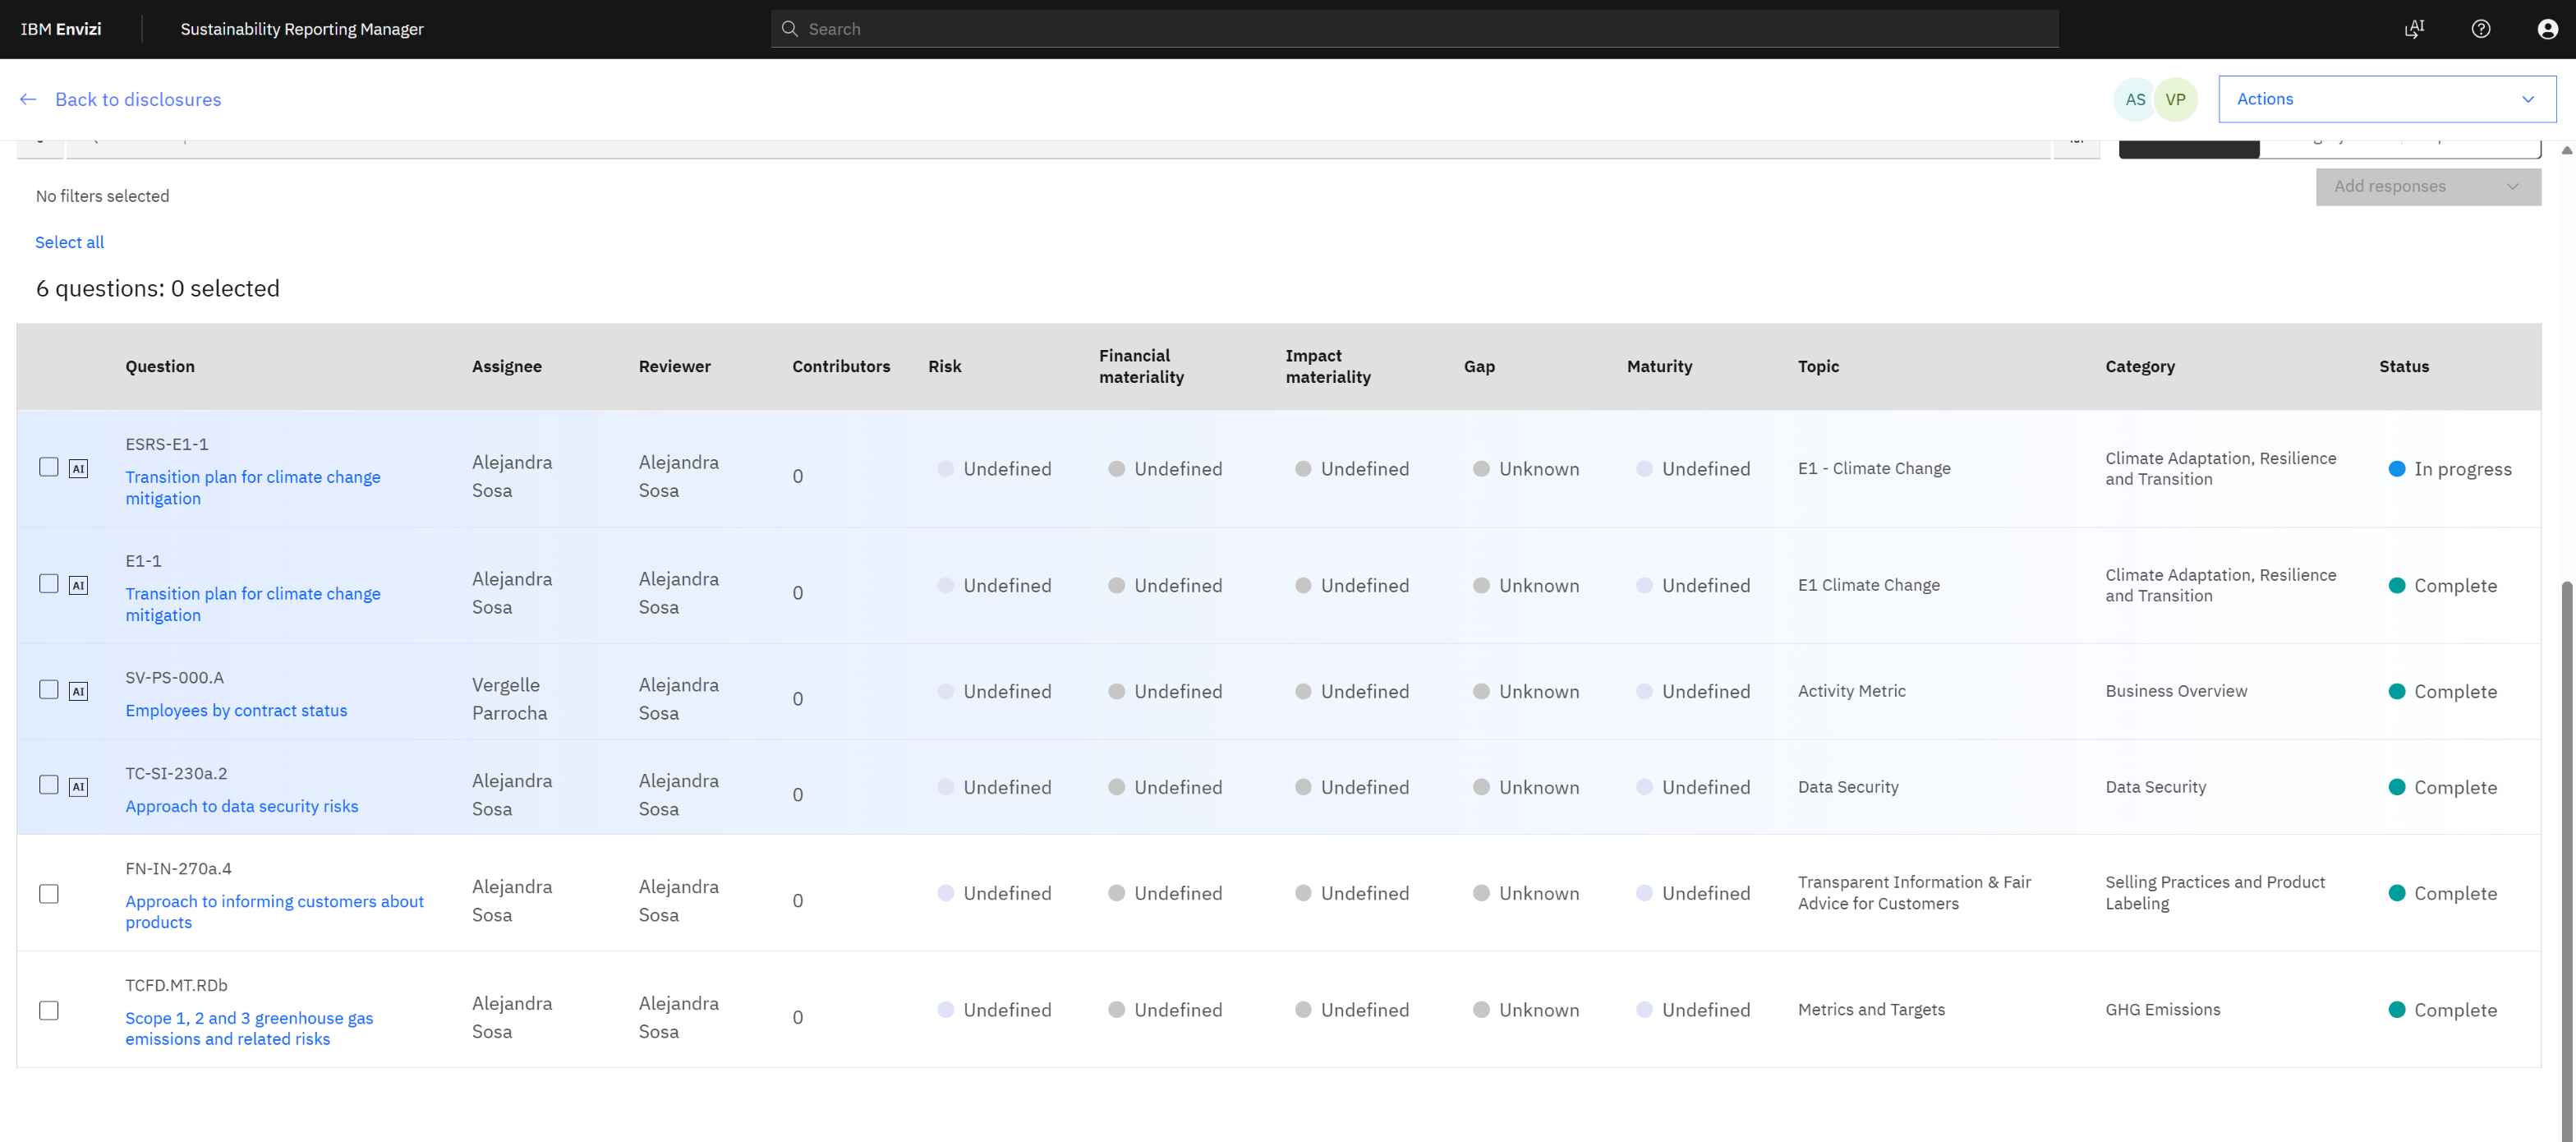
Inside "2026 Internal Sustainability Statement": six questions from ESRS, SASB and TCFD. The last one, TCFD.MT.RDb, asks for Scope 1, 2 and 3 greenhouse gas emissions.
That last question is where the three use cases meet. The answer to "Scope 1, 2 and 3 emissions" is not typed by a person. It is the sum of the records in the accounts of section 4, converted by the factors of section 5. The disclosure tool adds what a spreadsheet cannot: who answered, who reviewed, what was said last year, and an export to a document when the work is done.
7. After the report: programs and actions
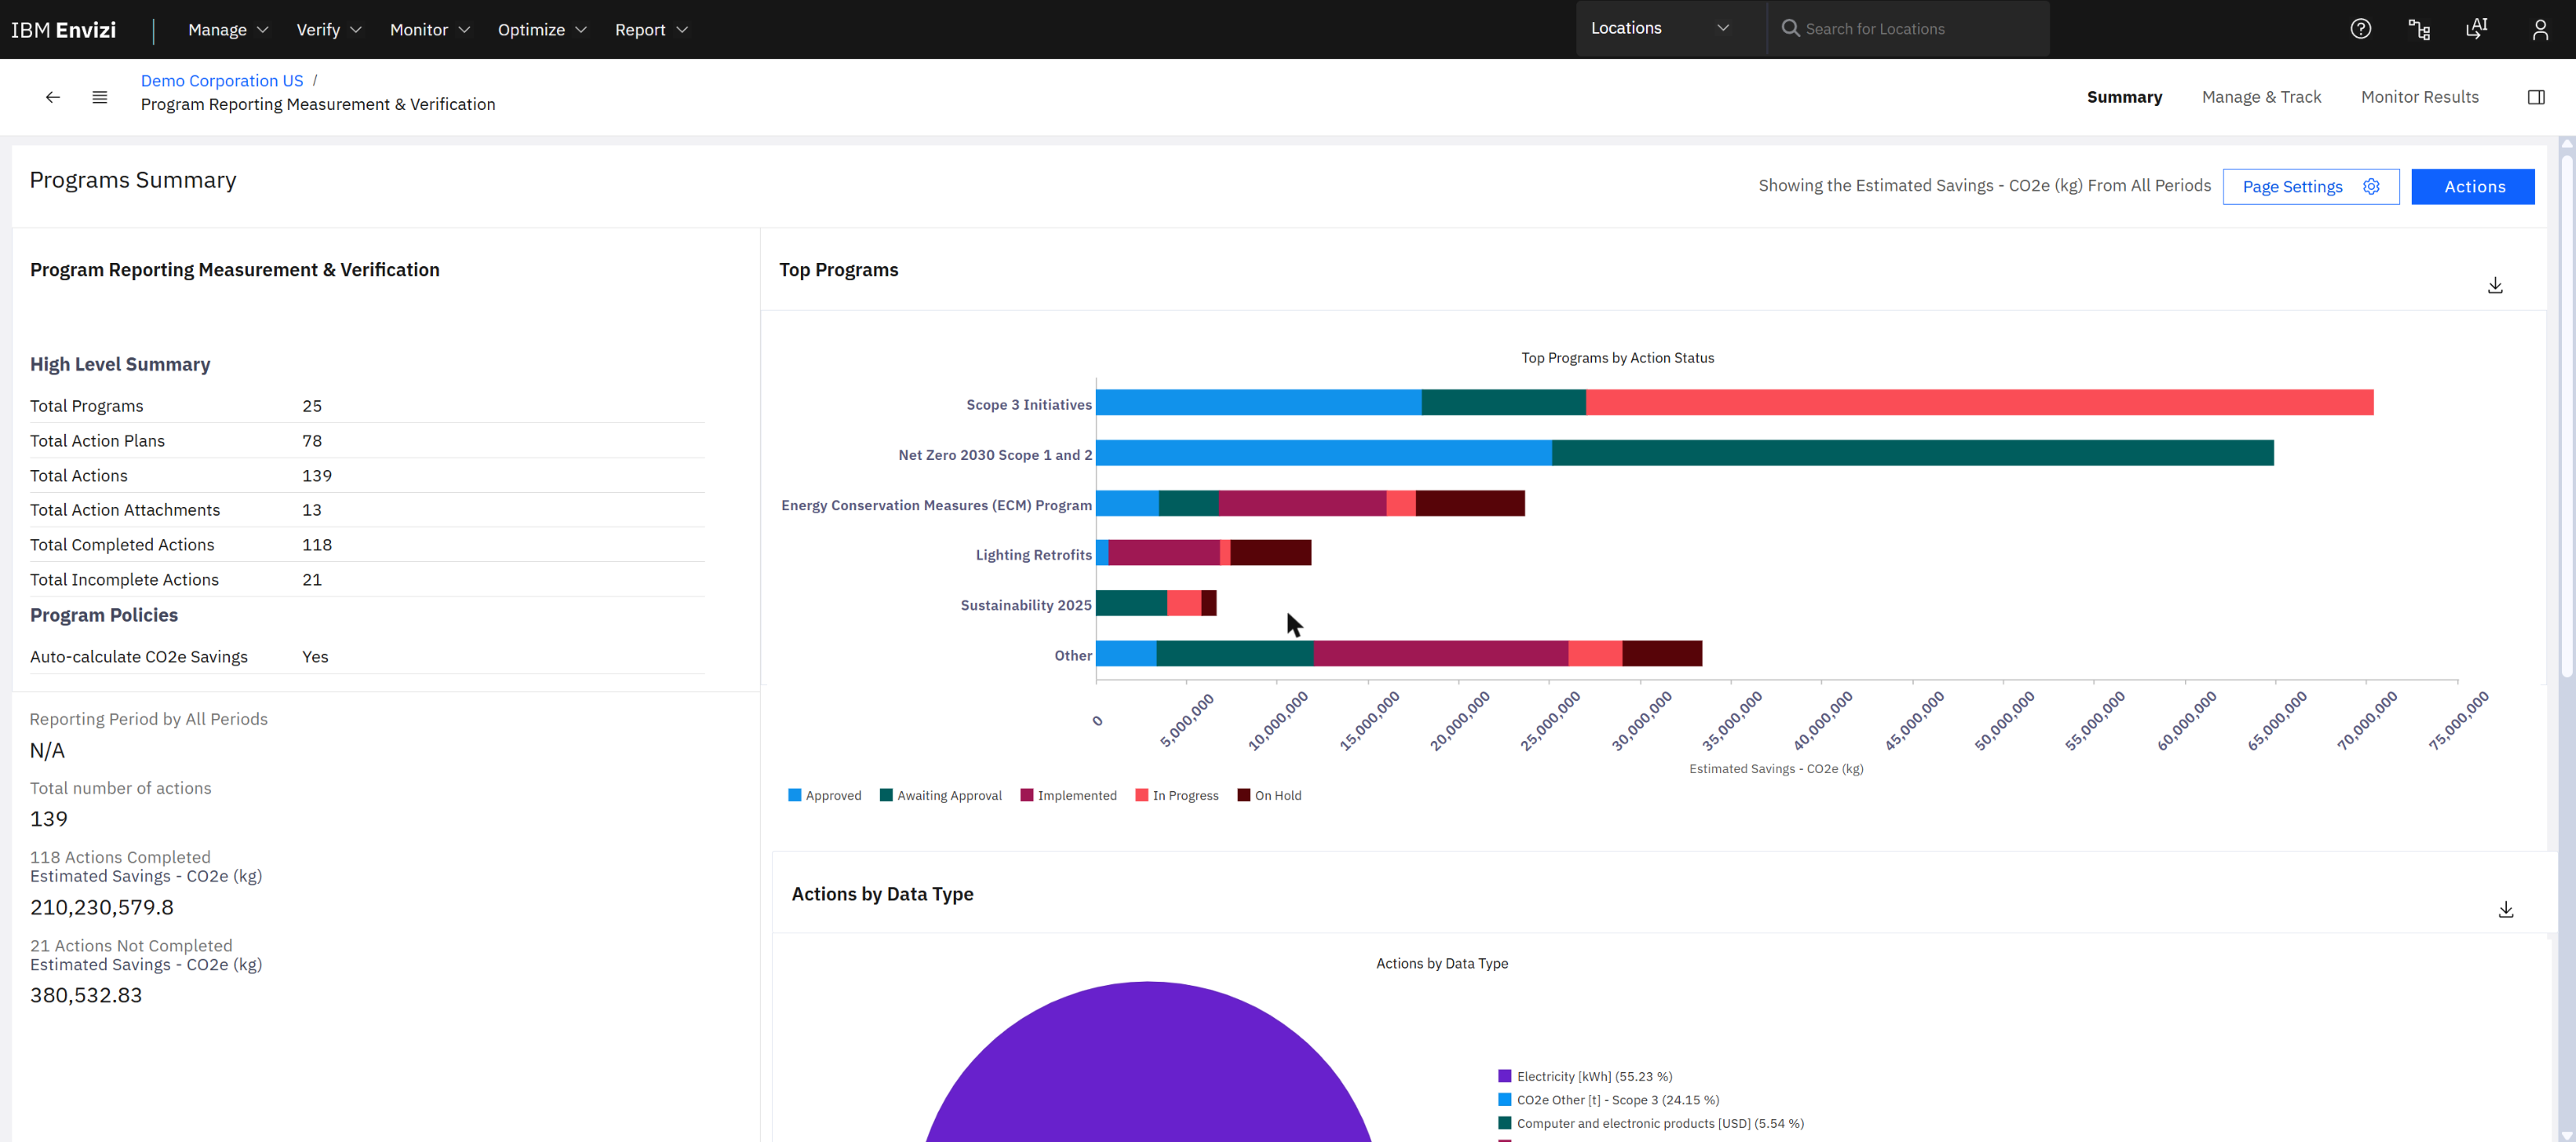
Optimize › Programs › Summary: 25 programs, 78 action plans, 139 actions, 118 of them completed. "Scope 3 Initiatives" and "Net Zero 2030 Scope 1 and 2" carry the largest estimated savings.
An action is one initiative, for example a lighting retrofit at one building, with an implementation cost, an estimated saving in energy, money and CO2e, a status and dates. The page also checks its own data: on the demo, 45 actions have no quantitative data and 13 have no finish date.
This is the bridge to Maximo. A reduction action usually ends as work on an asset: replace a chiller, retune a boiler, fix a leak. Envizi holds the target and the measured result; the maintenance system holds the work. IBM publishes integrations between Envizi and both Maximo and TRIRIGA; they are outside this guide.
8. Use case 4: Scope 3 in depth
Section 5.3 showed Scope 3 as one report. For most companies it is the largest part of the footprint and the hardest to measure, because the data belongs to somebody else. IBM's demonstrations use three categories to show how Envizi handles it: what you buy, what you rent, and what you finance.
8.1 What you buy: four ways to calculate the same thing
Category 1 (purchased goods and services) and category 2 (capital goods) share four calculation methods defined by the GHG Protocol. They trade accuracy against how hard the data is to get.
| Method |
The arithmetic |
Where the data comes from |
Envizi's accuracy rating |
| Spend-based |
money spent × an industry factor per dollar |
ERP or finance system; factor from an economic database (EEIO) |
Poor |
| Average-data |
quantity bought (kg, units) × an average factor for that commodity |
ERP; factor from a public or commercial library |
Fair |
| Hybrid |
the supplier's own Scope 1 and 2 × your share of its revenue |
Supplier survey, or a data provider such as CDP Supply Chain or EcoVadis; spend from the ERP |
Average |
| Supplier-specific |
quantity bought × the supplier's own factor for that product |
The supplier's product carbon footprint |
Excellent |
How companies really do it. They start with spend for everybody, because the data is already in the ERP. Then they move the few suppliers that matter most to better methods, and leave the long tail on spend for good. Envizi lets the four methods live side by side and tells you which share of the number comes from which.
Spend-based. One account per supplier or per spend category. Each record is an invoice or a monthly total.
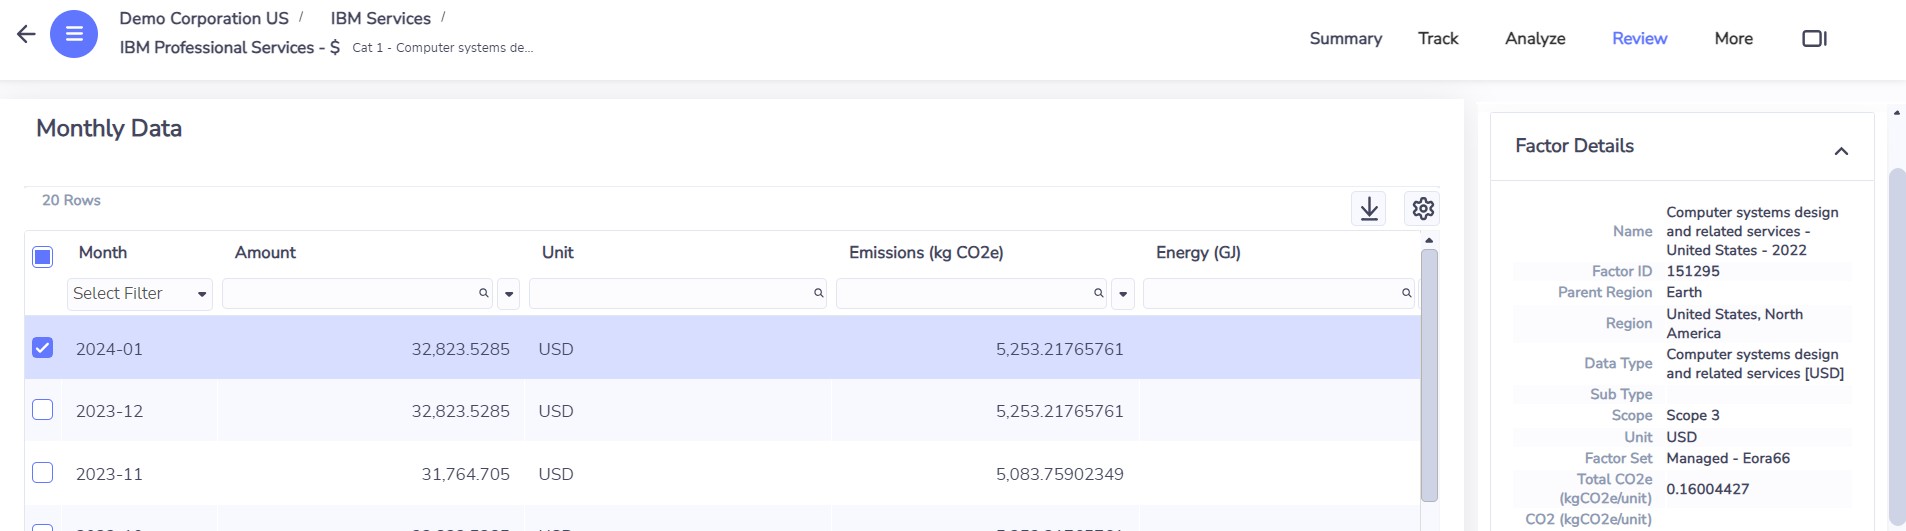
IBM Professional Services, spend method. January 2024: 32,823.53 USD × 0.16 kg CO2e per USD (computer systems design, Eora66 factor set) = 5,253 kg CO2e.
Average-data. The account holds quantities, not money.
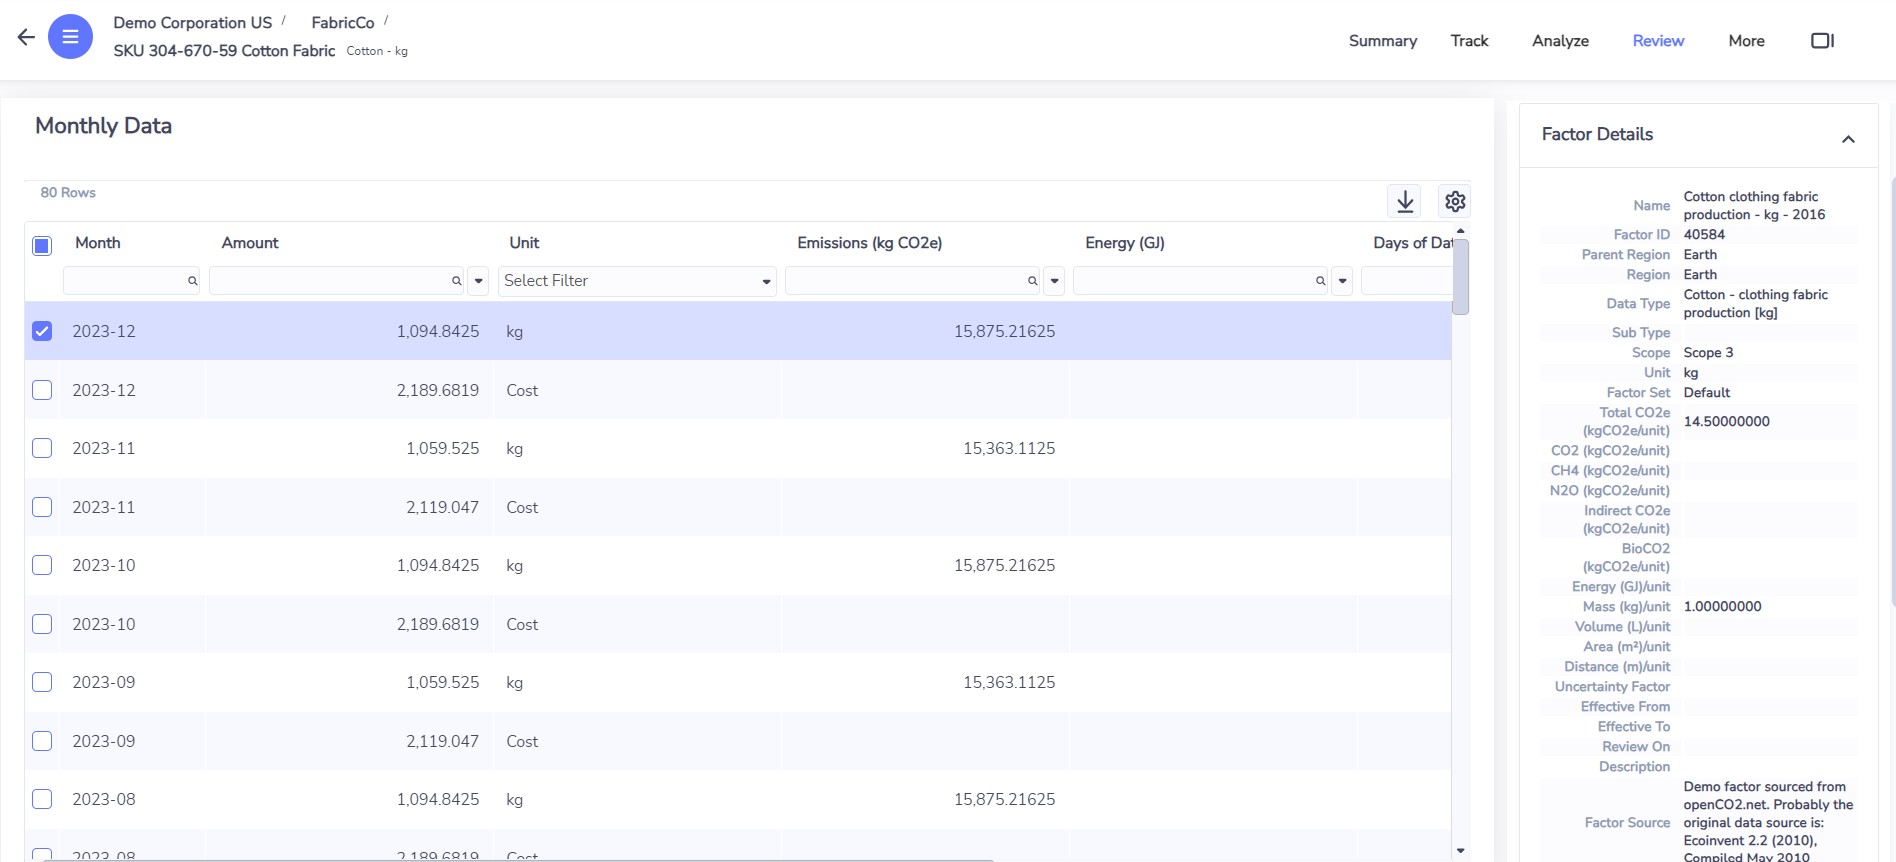
Cotton fabric, by weight. December 2023: 1,094.84 kg × 14.5 kg CO2e per kg = 15,875 kg CO2e. The side panel names the factor and its source.
Supplier-specific. Same shape, but the factor is the supplier's own, loaded as a custom factor.
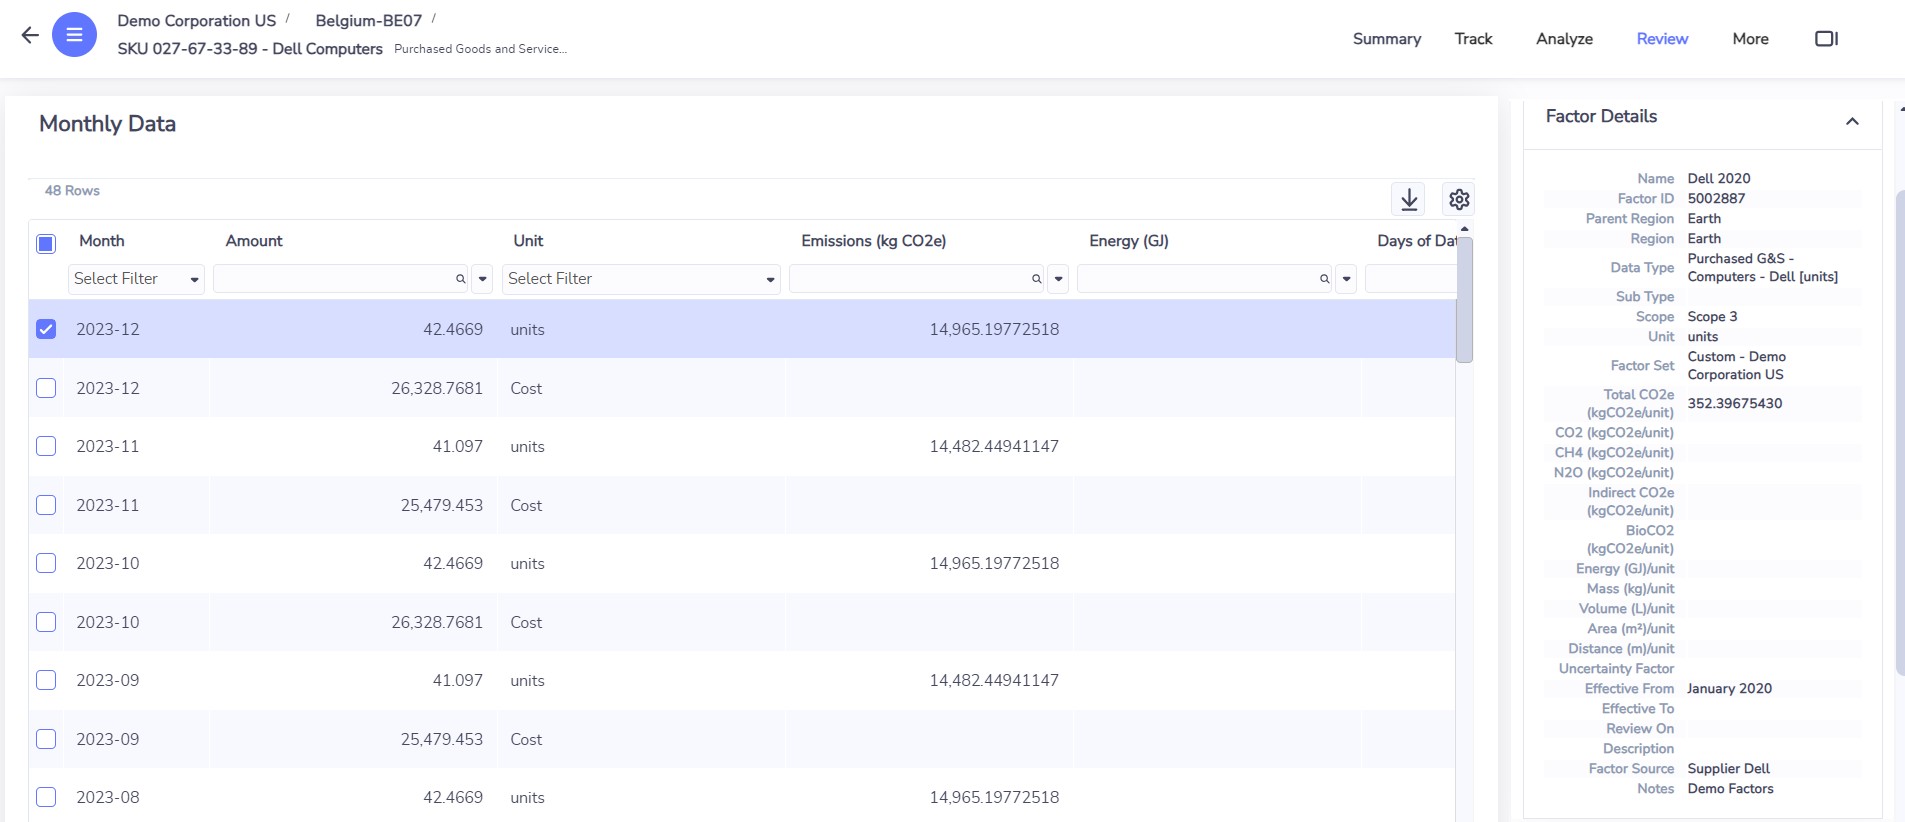
Dell computers, by unit. The factor (352.4 kg CO2e per unit) is in a custom factor set, with the supplier as its source.
Hybrid. This one needs three accounts for a supplier and a little arithmetic between them.
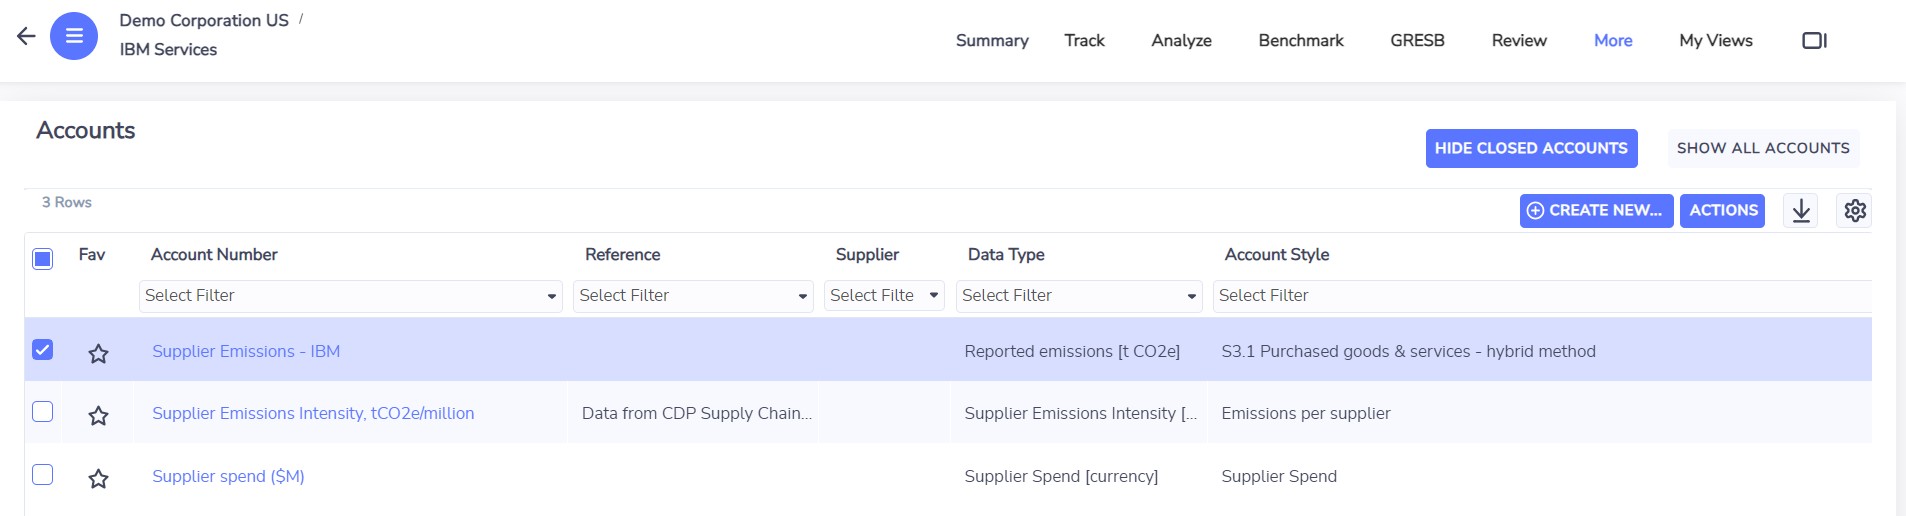
The supplier 'IBM Services' as a location with three accounts: emissions intensity from CDP Supply Chain, spend on the supplier, and the calculated supplier emissions.
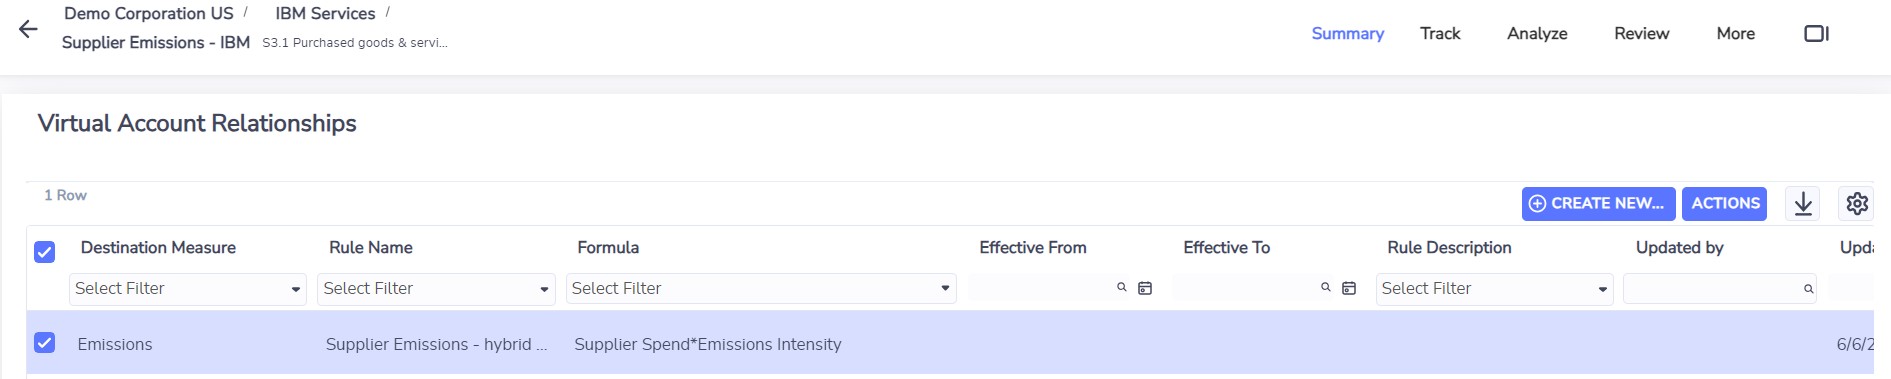
The third account is a virtual account. Its rule: supplier spend × emissions intensity.
Virtual account. An account whose records are calculated from other accounts by a rule. It is how Envizi does apportioning (your share of a supplier, a building or an investment) without a spreadsheet. You will see it again for leased space and for financed emissions.
8.2 Finding the hot spots
The Scope 3 Emissions Analysis report drills from all categories to one category, then to one supplier.
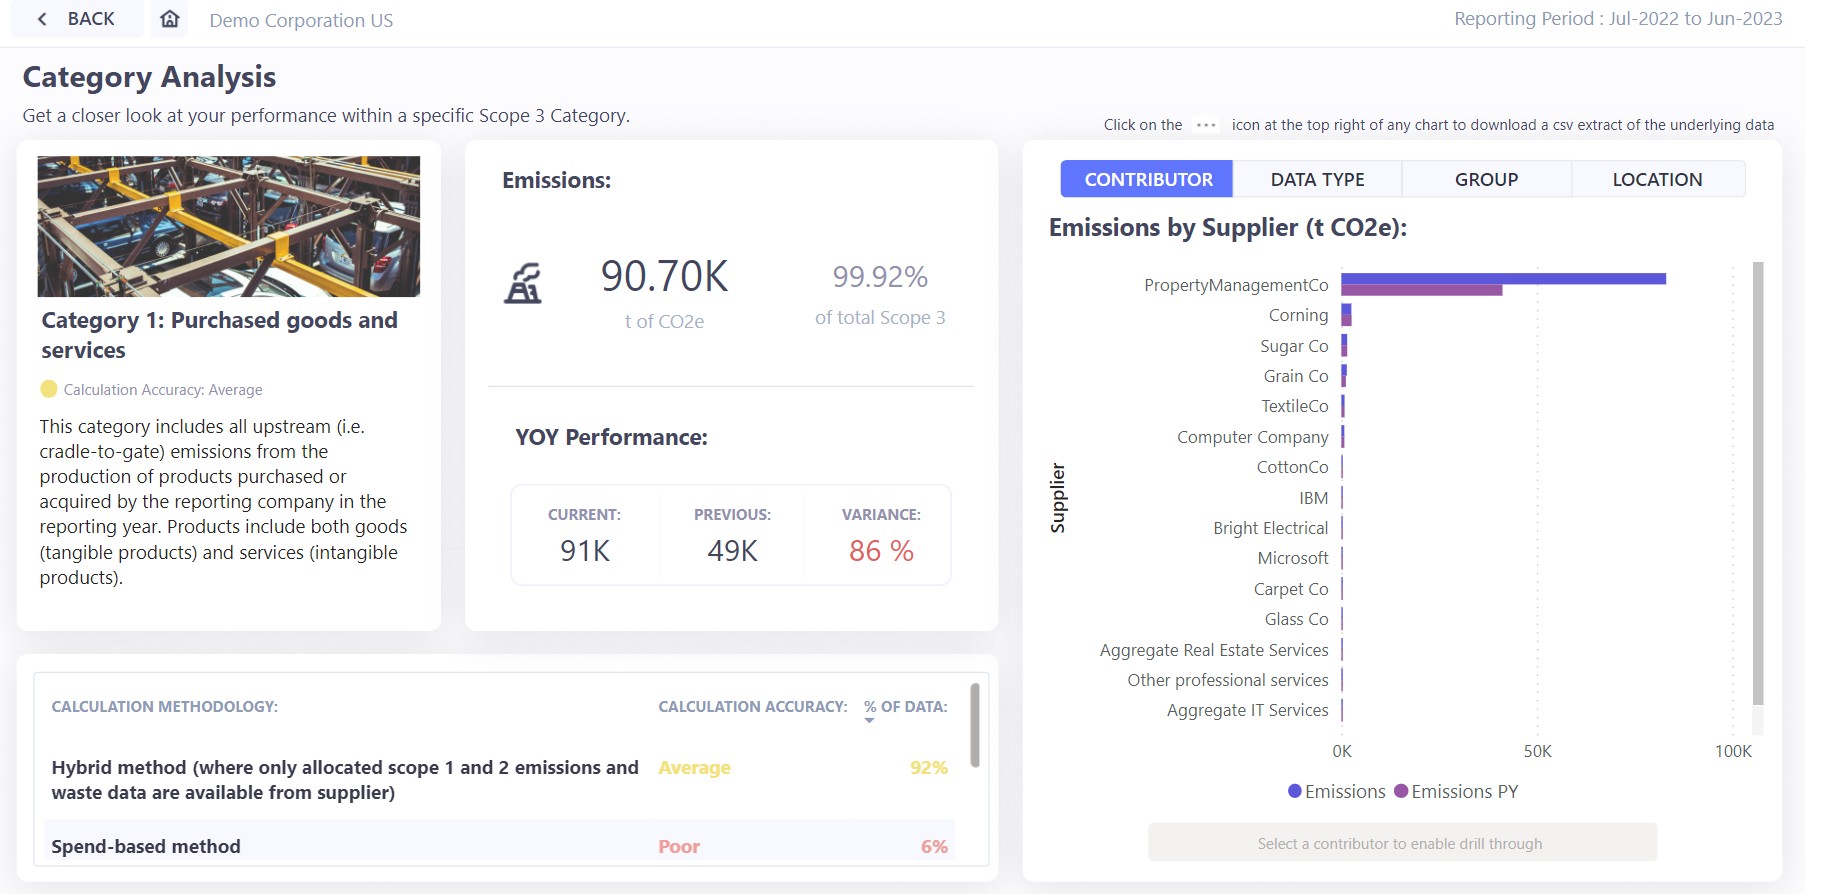
Category 1: 90.70 thousand tonnes, up 86% on the previous year. 92% of it is calculated with the hybrid method (rated average), 6% with spend (rated poor). One supplier dominates.
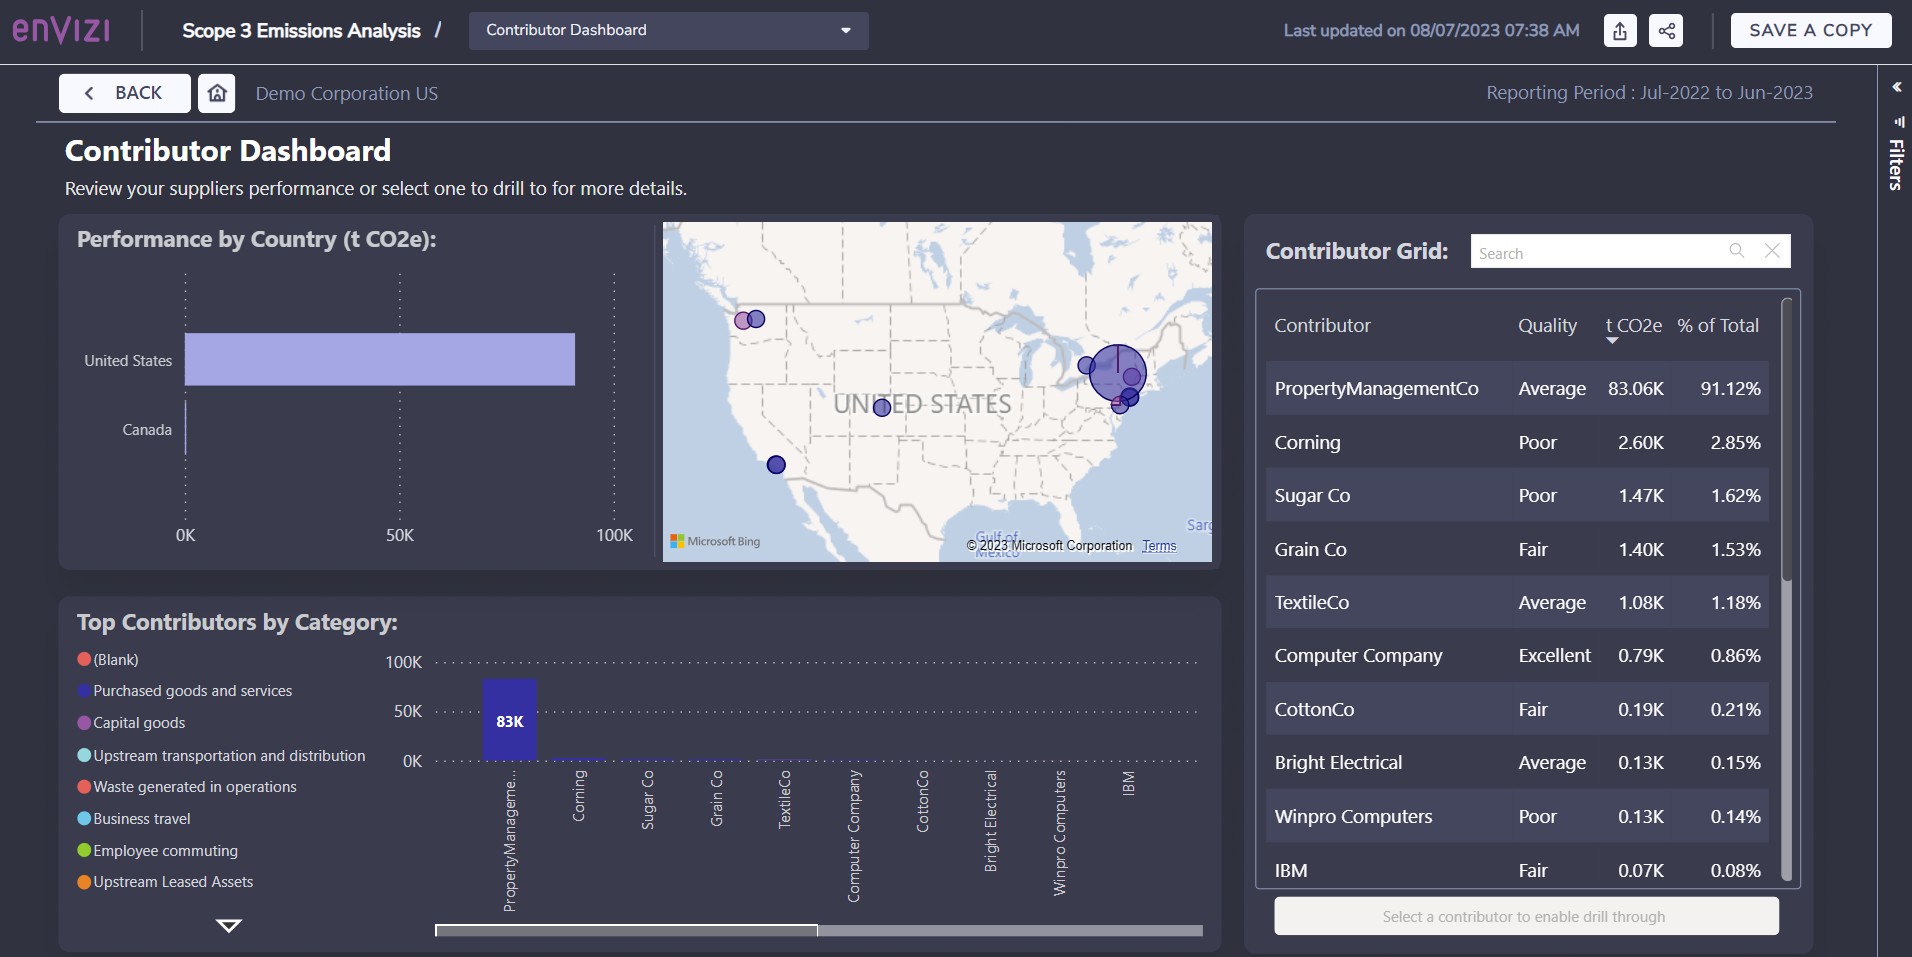
The contributor dashboard: emissions by country, by category and by supplier, each with its data quality. PropertyManagementCo is 91% of the selection.
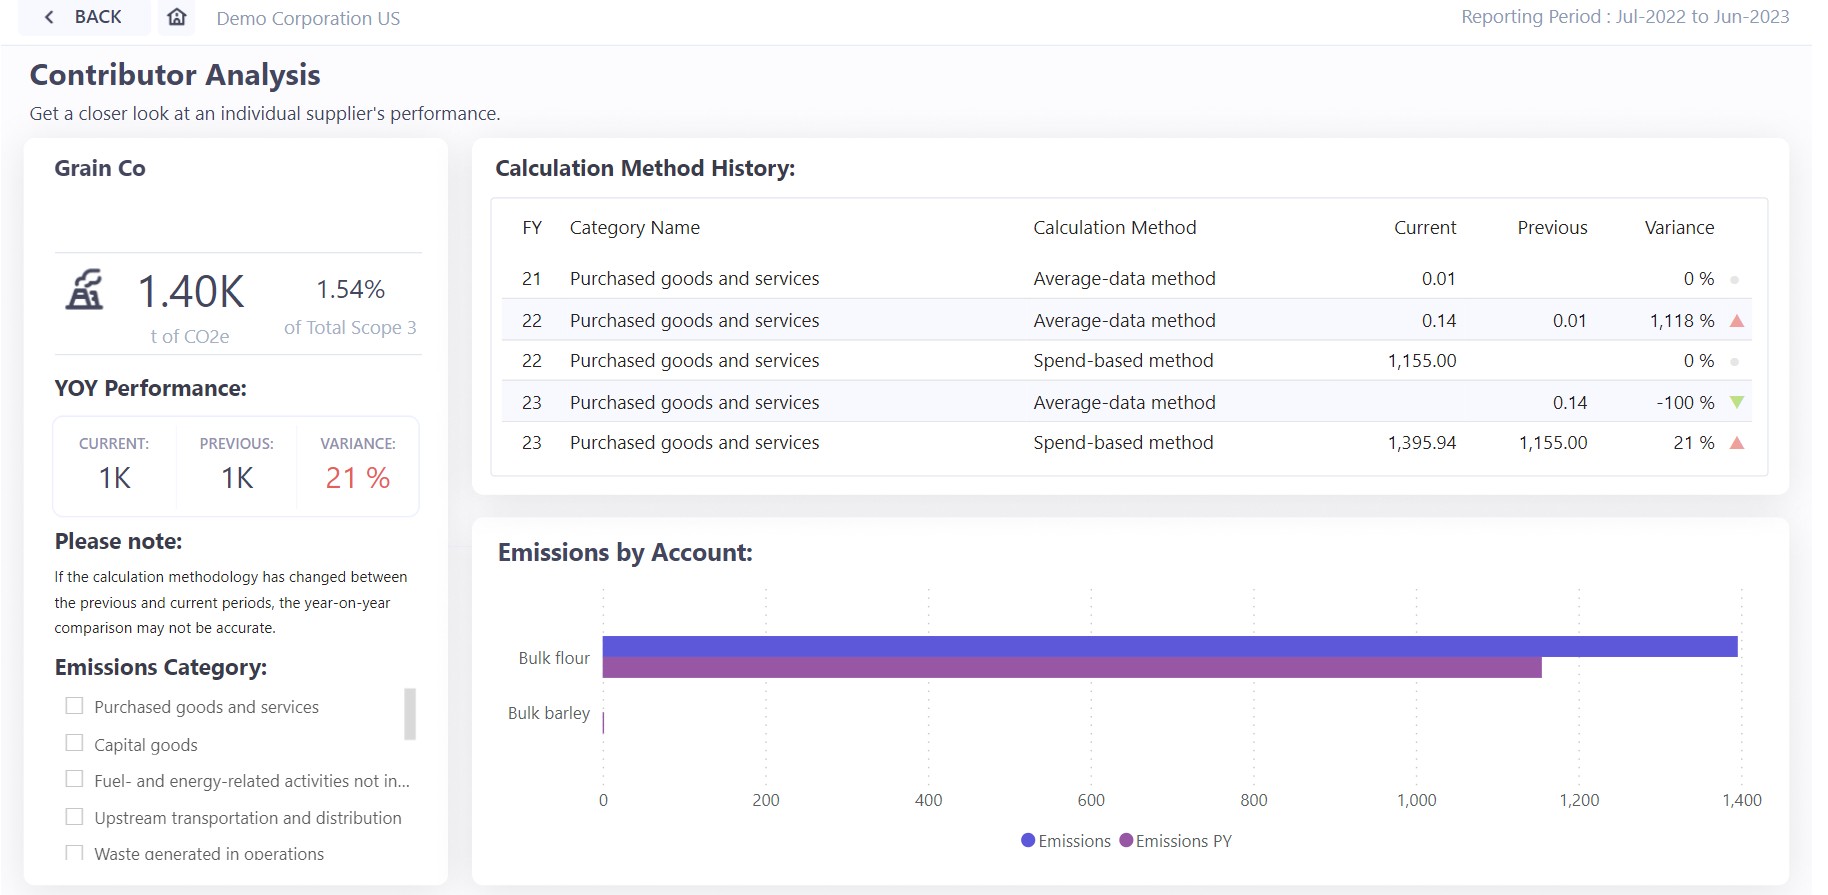
One supplier, Grain Co. The calculation method changed between years (average-data and spend-based), so the year-on-year figure is not a like-for-like comparison. The page says so.
A jump is not always a real jump. In the demo, category 1 rises 86% mostly because data was not captured before. When the method or the coverage changes, the trend tells you about your data, not about your suppliers.
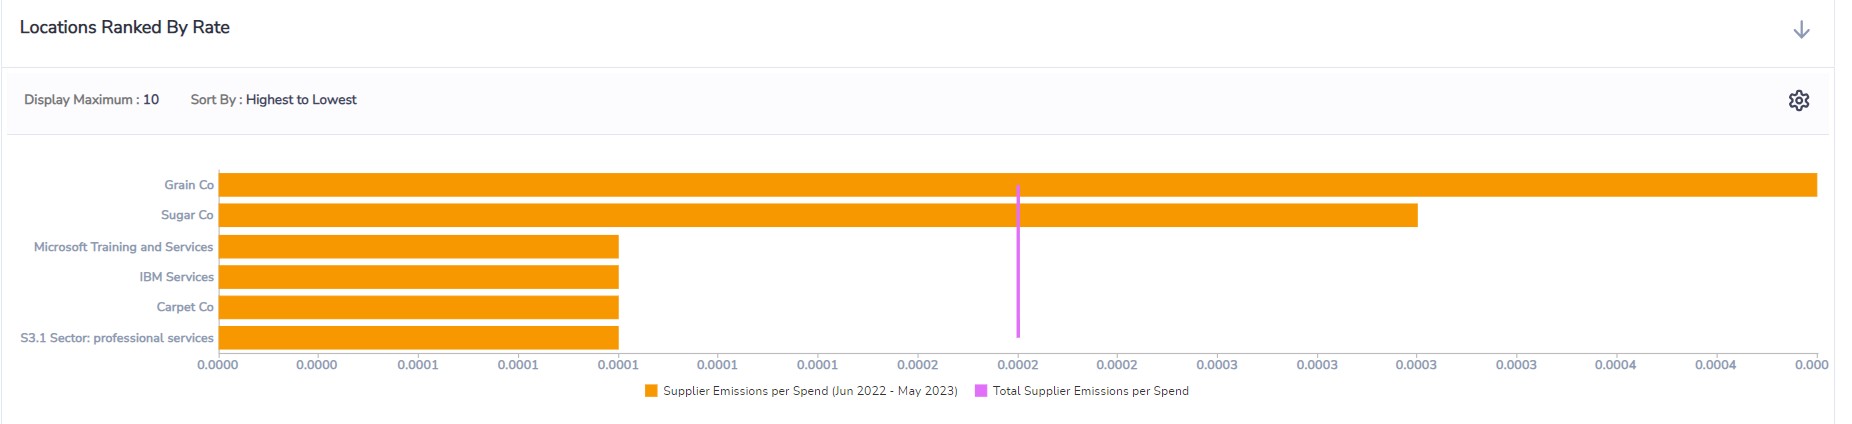
Rate analysis: suppliers ranked by emissions per dollar spent. This is how you compare two suppliers of the same thing.
8.3 How good is the number?
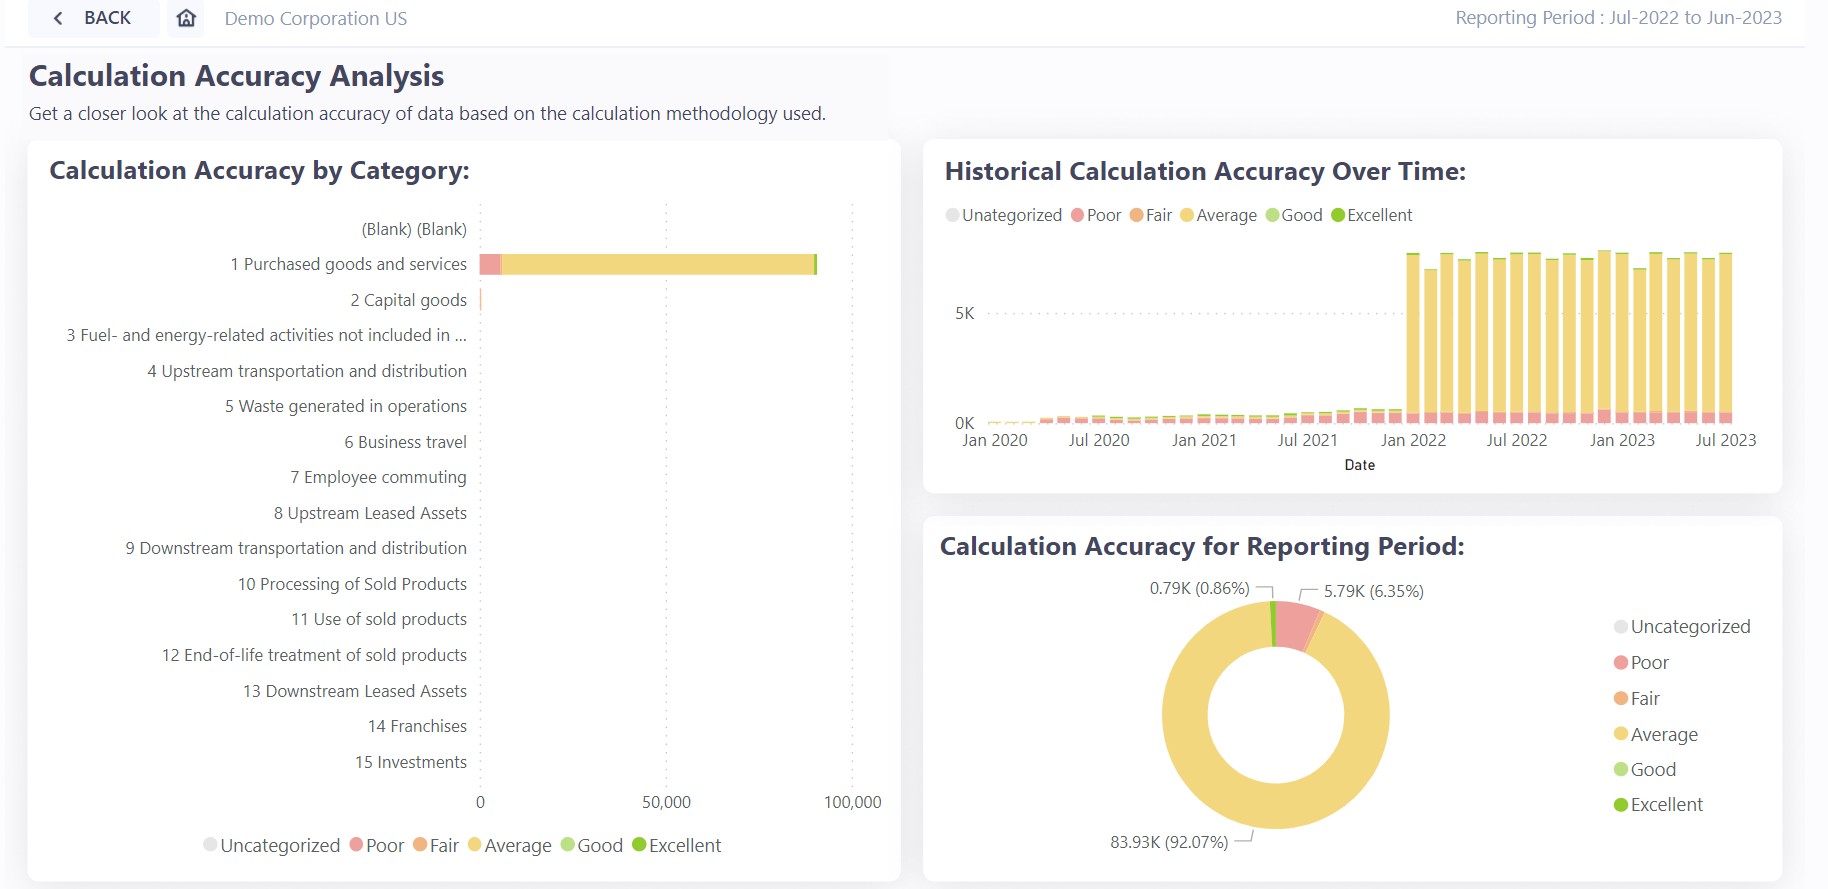
Calculation accuracy: 92% of category 1 emissions are rated 'average' (hybrid), 6% 'poor' (spend), under 1% 'excellent'. The chart over time shows whether you are improving.
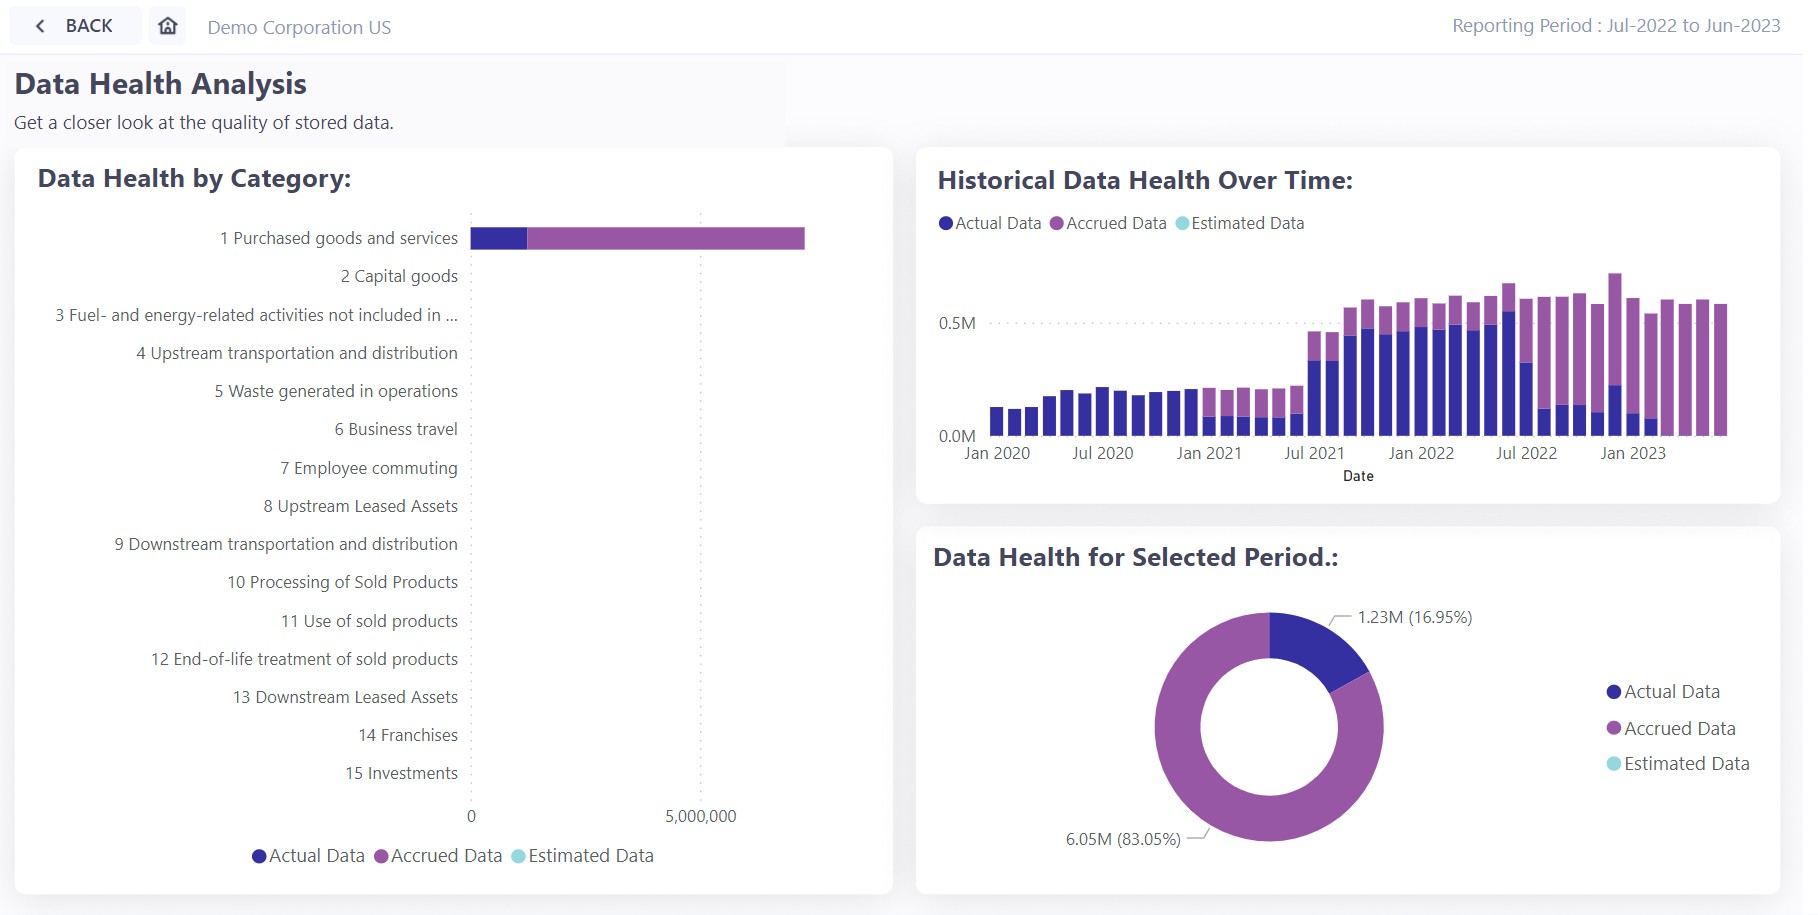
Data health for the same category: 17% actual data, 83% accrued. Accruals keep the total complete for reporting, but they are estimates from past patterns and say nothing about trends.
These two pages answer the auditor's question before it is asked: how was it calculated, and how much of it was measured.
8.4 What you rent: upstream leased assets
Category 8 covers space you lease from a landlord. The demo shows two offices handled in two ways.
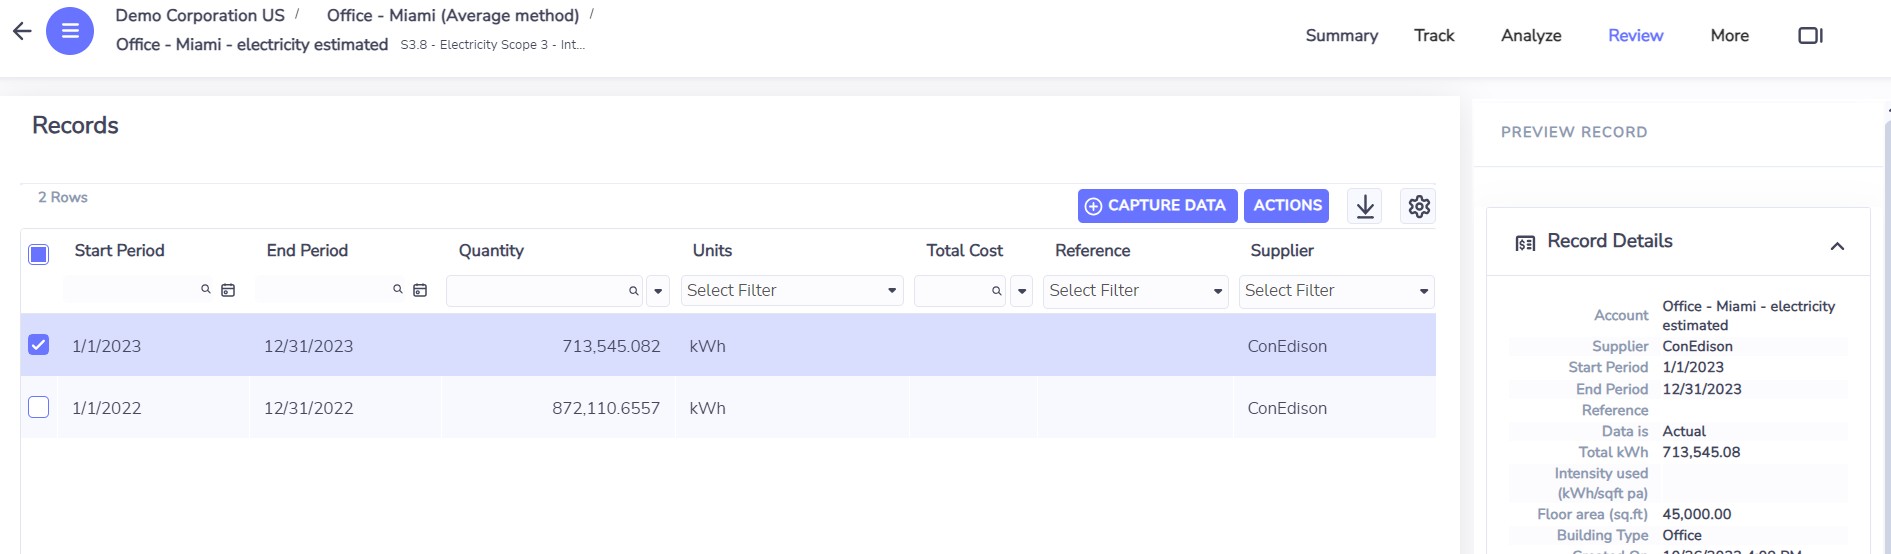
Office in Miami, average method. No meter and no bill: 45,000 sq ft of office × a published energy intensity for offices gives an estimated 713,545 kWh for the year.
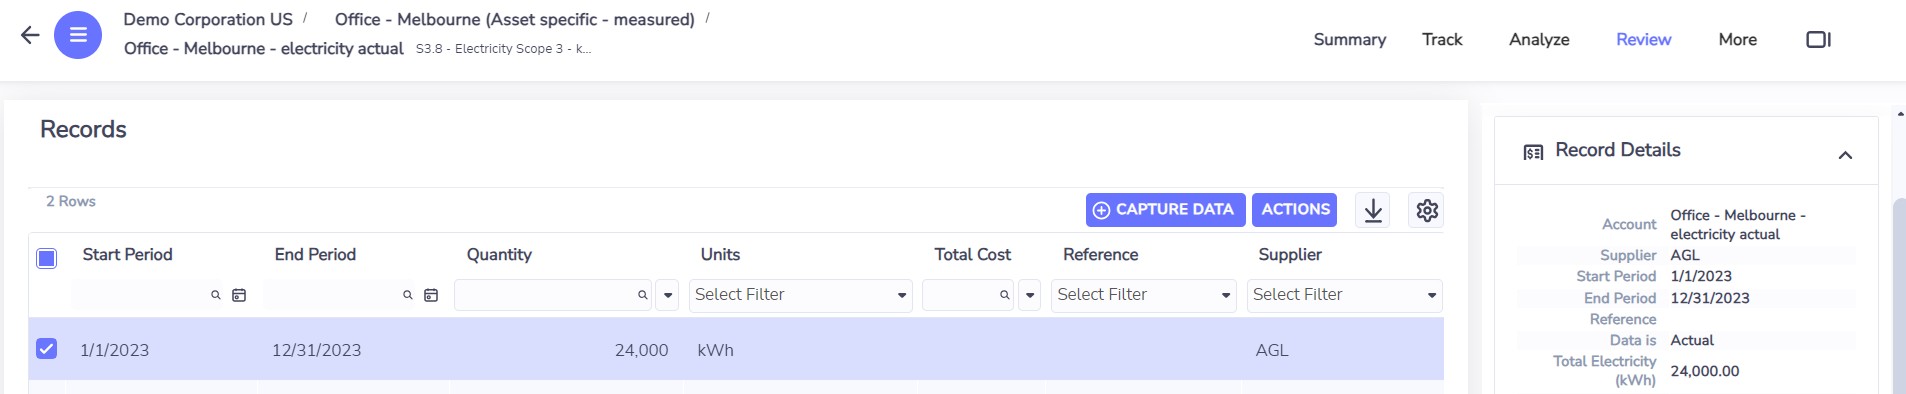
Office in Melbourne, actual consumption: 24,000 kWh for the year from a sub-meter or the tenant's own bill. Each office then gets the grid factor of its own region.
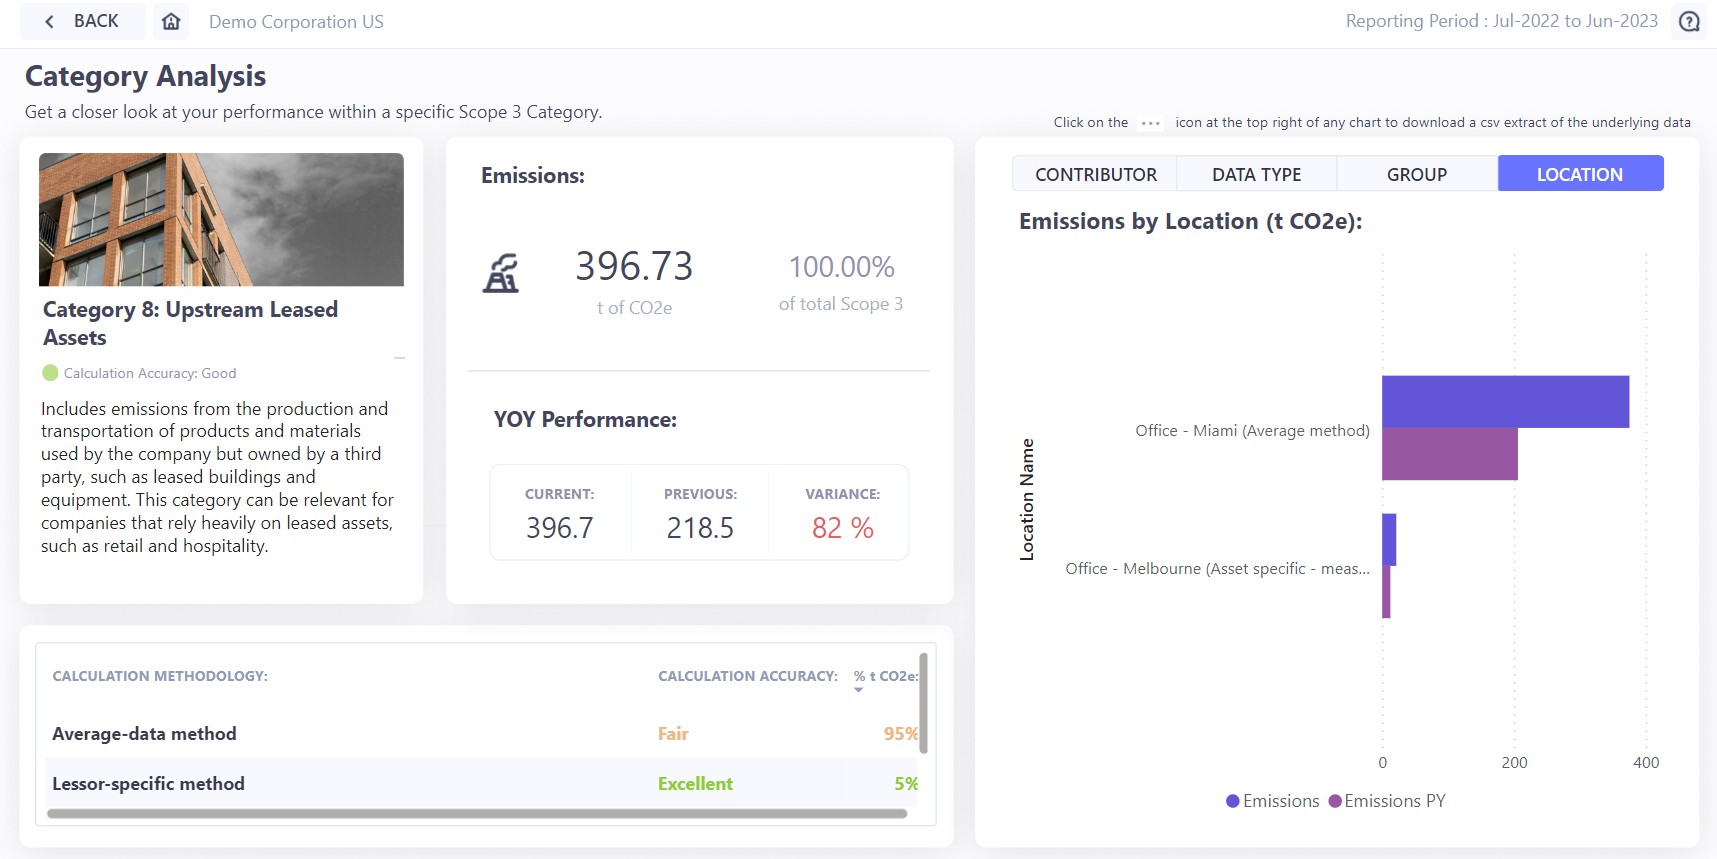
The category: 396.73 tonnes. 95% calculated with the average-data method (rated fair), 5% from actual data (rated excellent). Miami, the estimated office, is nearly all of it.
In Maximo terms
The floor area and building type that drive the estimate are exactly what TRIRIGA (Maximo Real Estate and Facilities) holds for every lease. The demo system has a group of locations fed from it.
8.5 What you finance: category 15
For a bank or a private equity firm, the footprint is in the companies it invests in. The standard here is PCAF, which ranks methods by a data quality score from 1 (best) to 5.
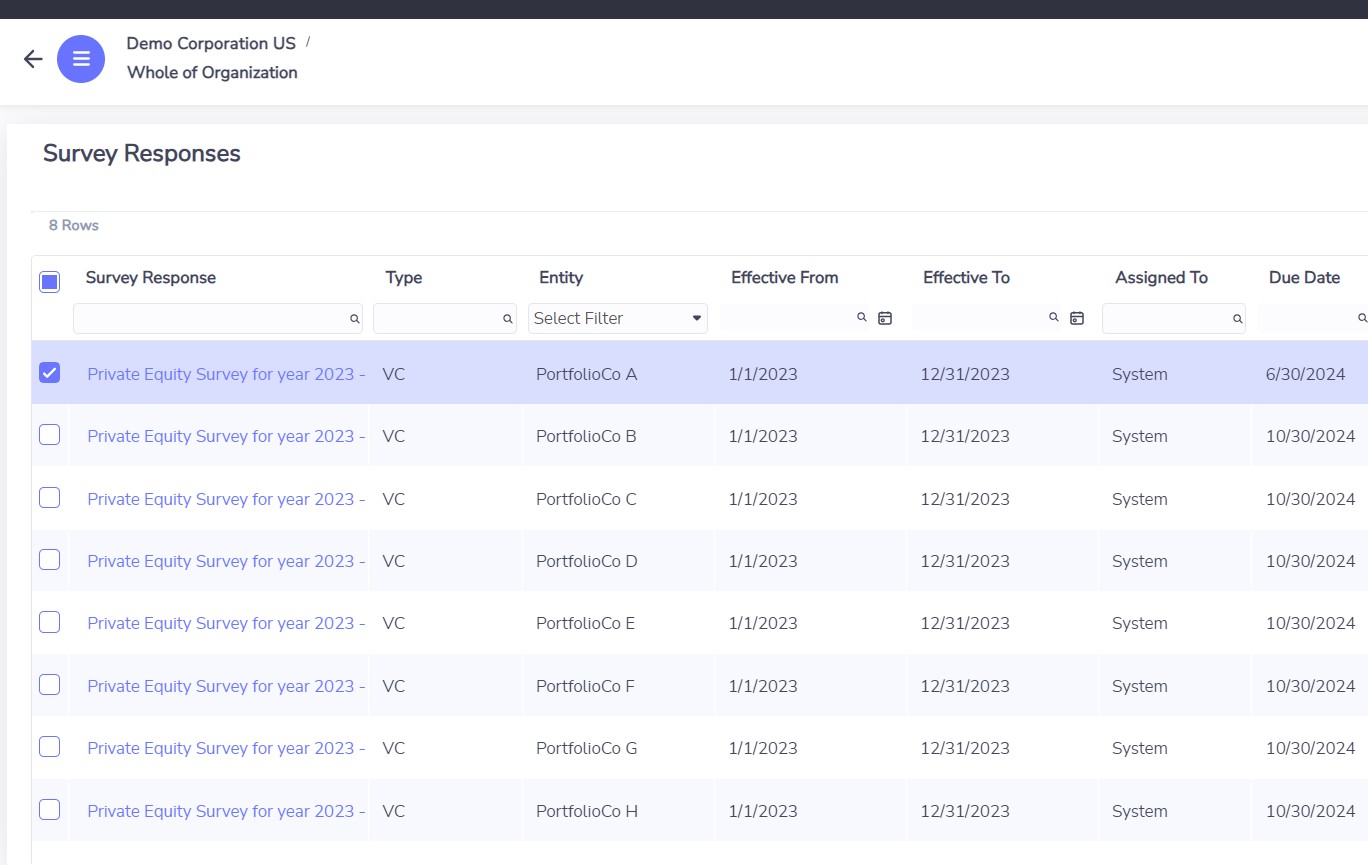
A survey sent to eight portfolio companies for 2023, each with its period and due date.
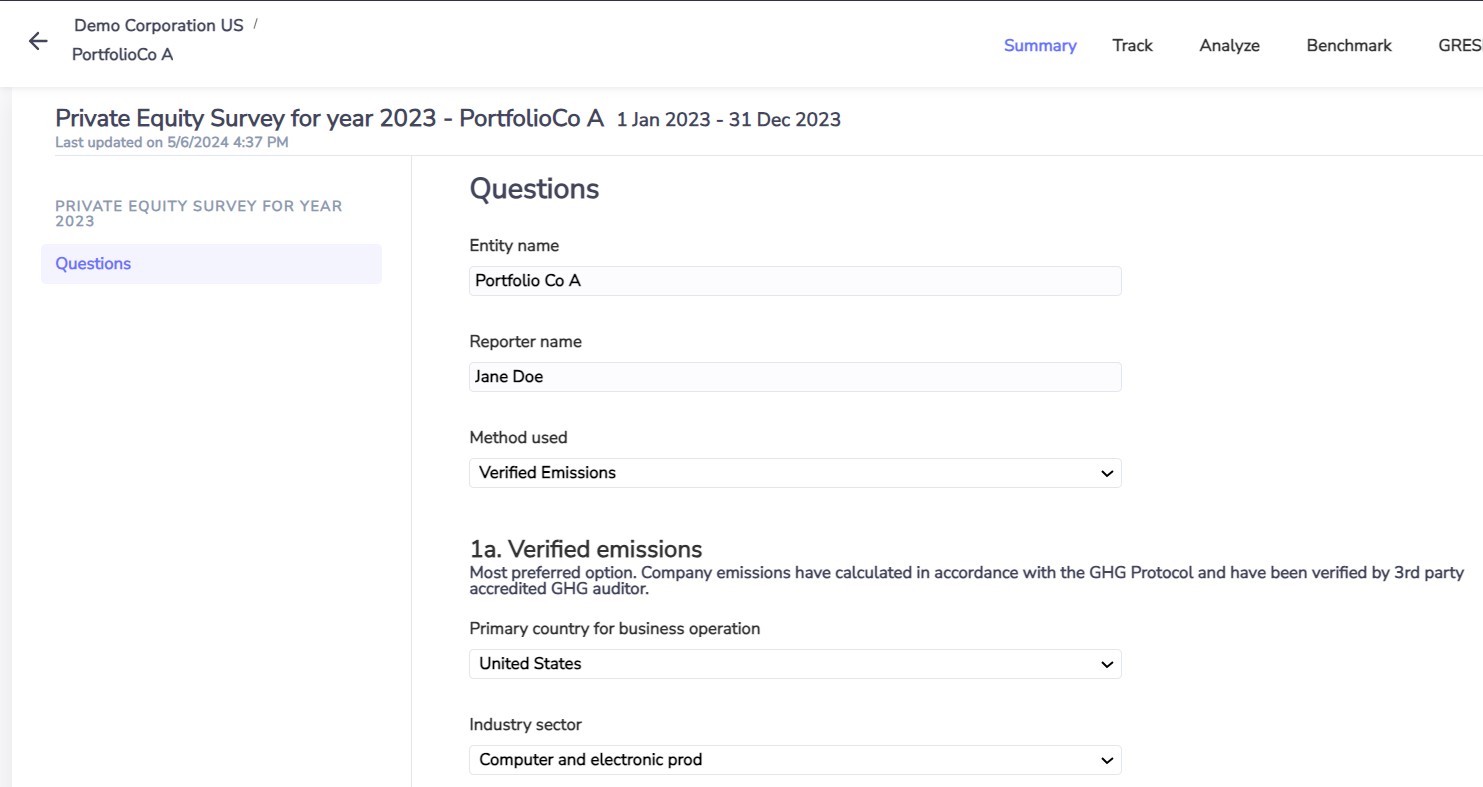
What a portfolio company sees: it chooses the method it can support (verified emissions, energy consumption, production, or revenue only) and the questions adapt.
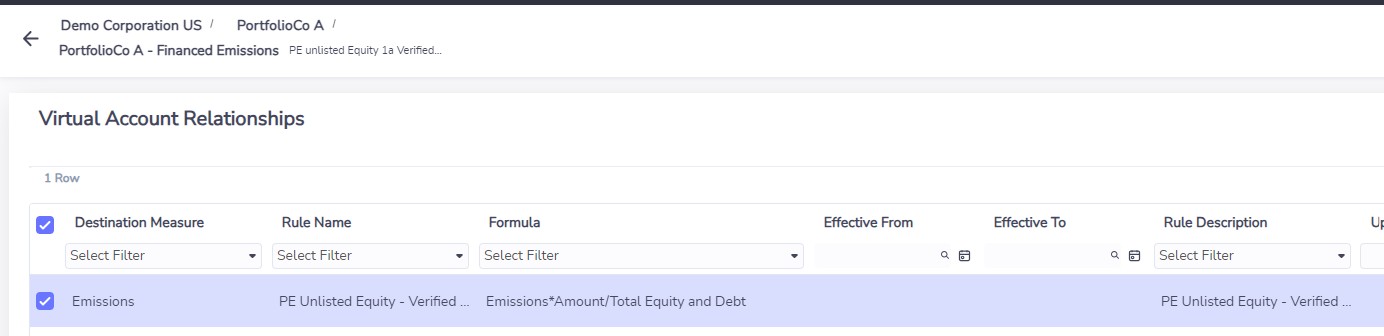
The financed emissions of PortfolioCo A: its emissions × the amount invested ÷ its total equity and debt.
The formula. Financed emissions = the company's emissions × (what you invested ÷ the company's total equity and debt). If you own 10% of the capital, 10% of the emissions are yours. The survey answers fill the accounts; a virtual account does the division.
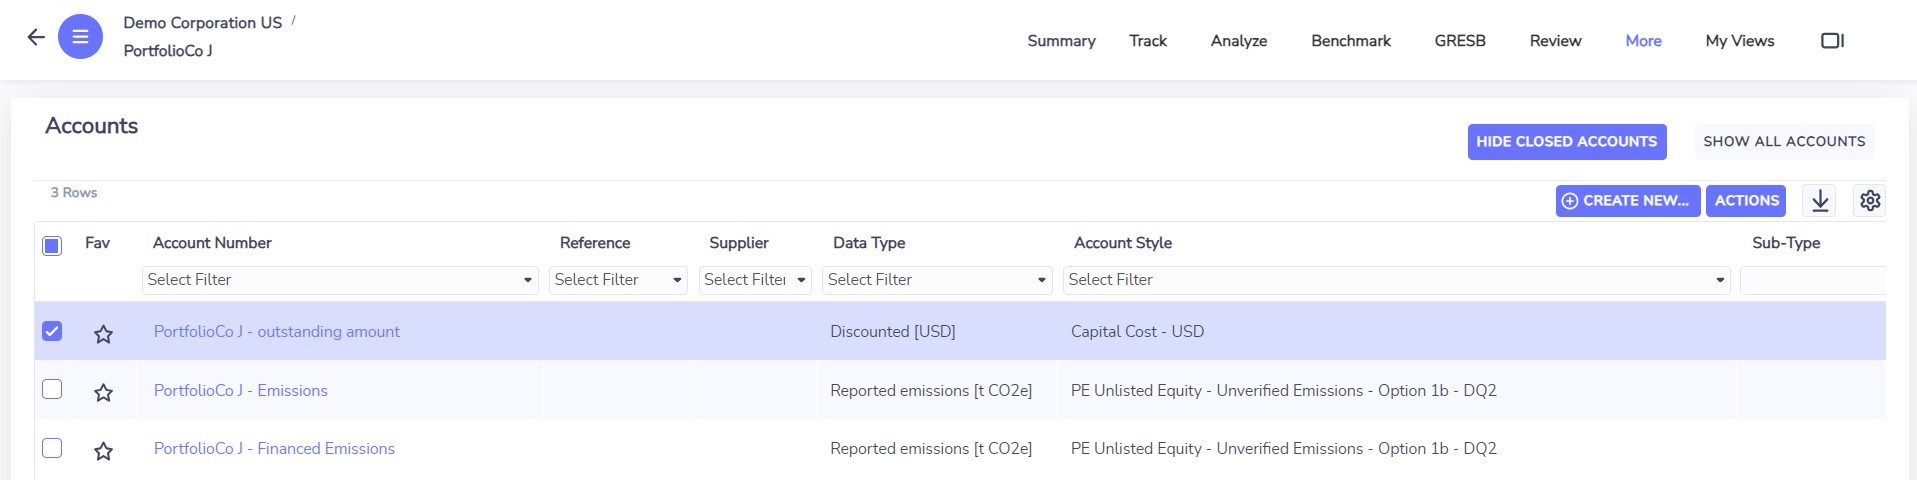
PortfolioCo J: the outstanding amount, the company's emissions, and the financed emissions. The account style carries the PCAF option and data quality score (here 1b, DQ2).
A portfolio company with no figures at all can give its revenue; Envizi then applies a sector factor, with the lowest quality score. One that is ready for more can be given its own corner of Envizi to record energy by building.
9. Use case 5: energy intelligence
This is the part of Envizi closest to maintenance and facilities people. Two modules: Utility Bill Analytics and Interval Meter Analytics. The idea is to start broad and go deeper only where it pays.
| Level |
Data |
Typical source |
What it answers |
| Bills (accounts) |
Cost and consumption per month |
Utility retailers, bill data services |
Where is the money going, which sites are out of line |
| Main meters |
Readings every 15 or 30 minutes for the whole site |
Meter data agents and aggregators |
When is energy used, peak demand, is it what we expect |
| Sub-meters |
The same, per system: HVAC, lighting, a tenant |
Building management system, through an edge device |
Which equipment, and did the upgrade work |
9.1 Bills
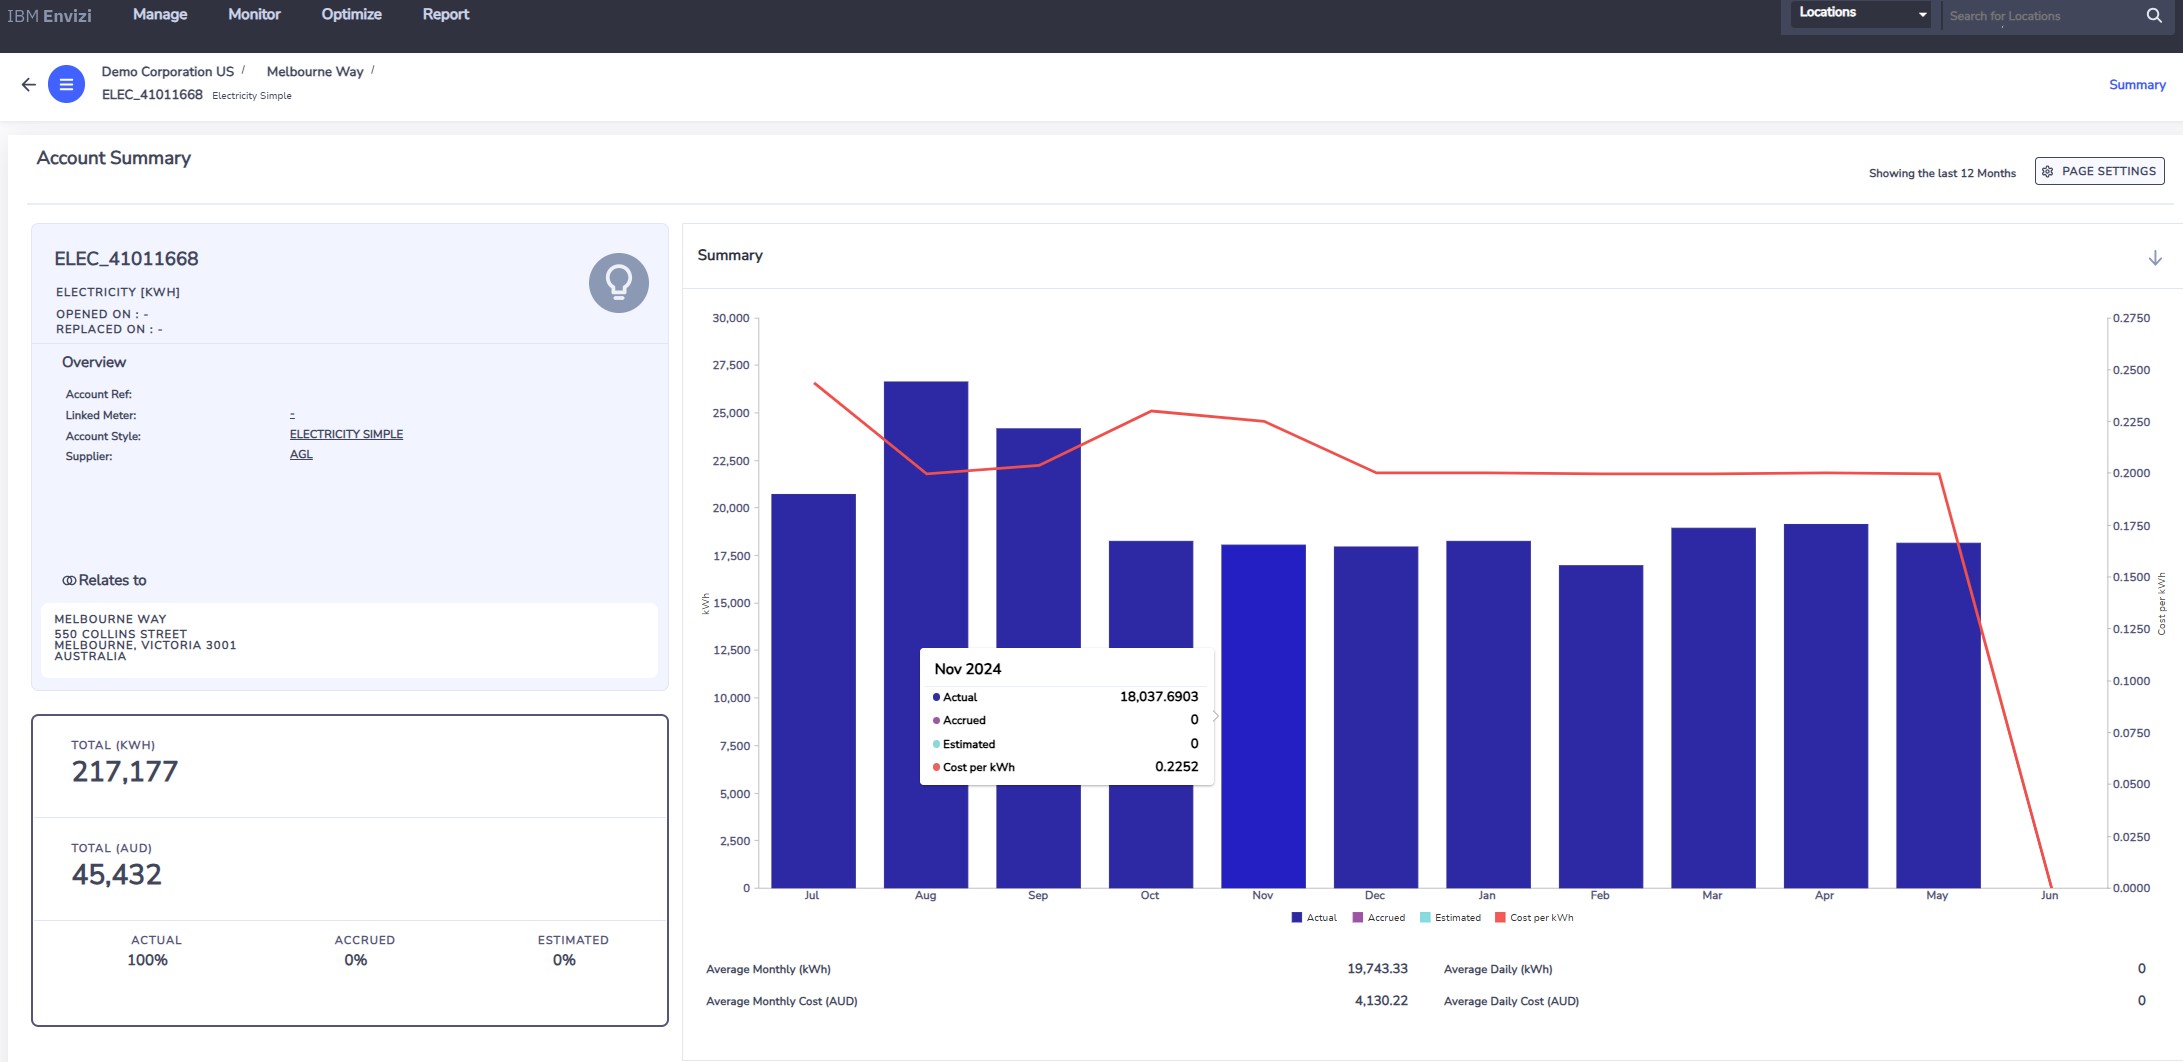
One electricity account at Melbourne Way: 217,177 kWh and 45,432 AUD over twelve months, 100% actual. Bars are consumption, the line is the unit cost.
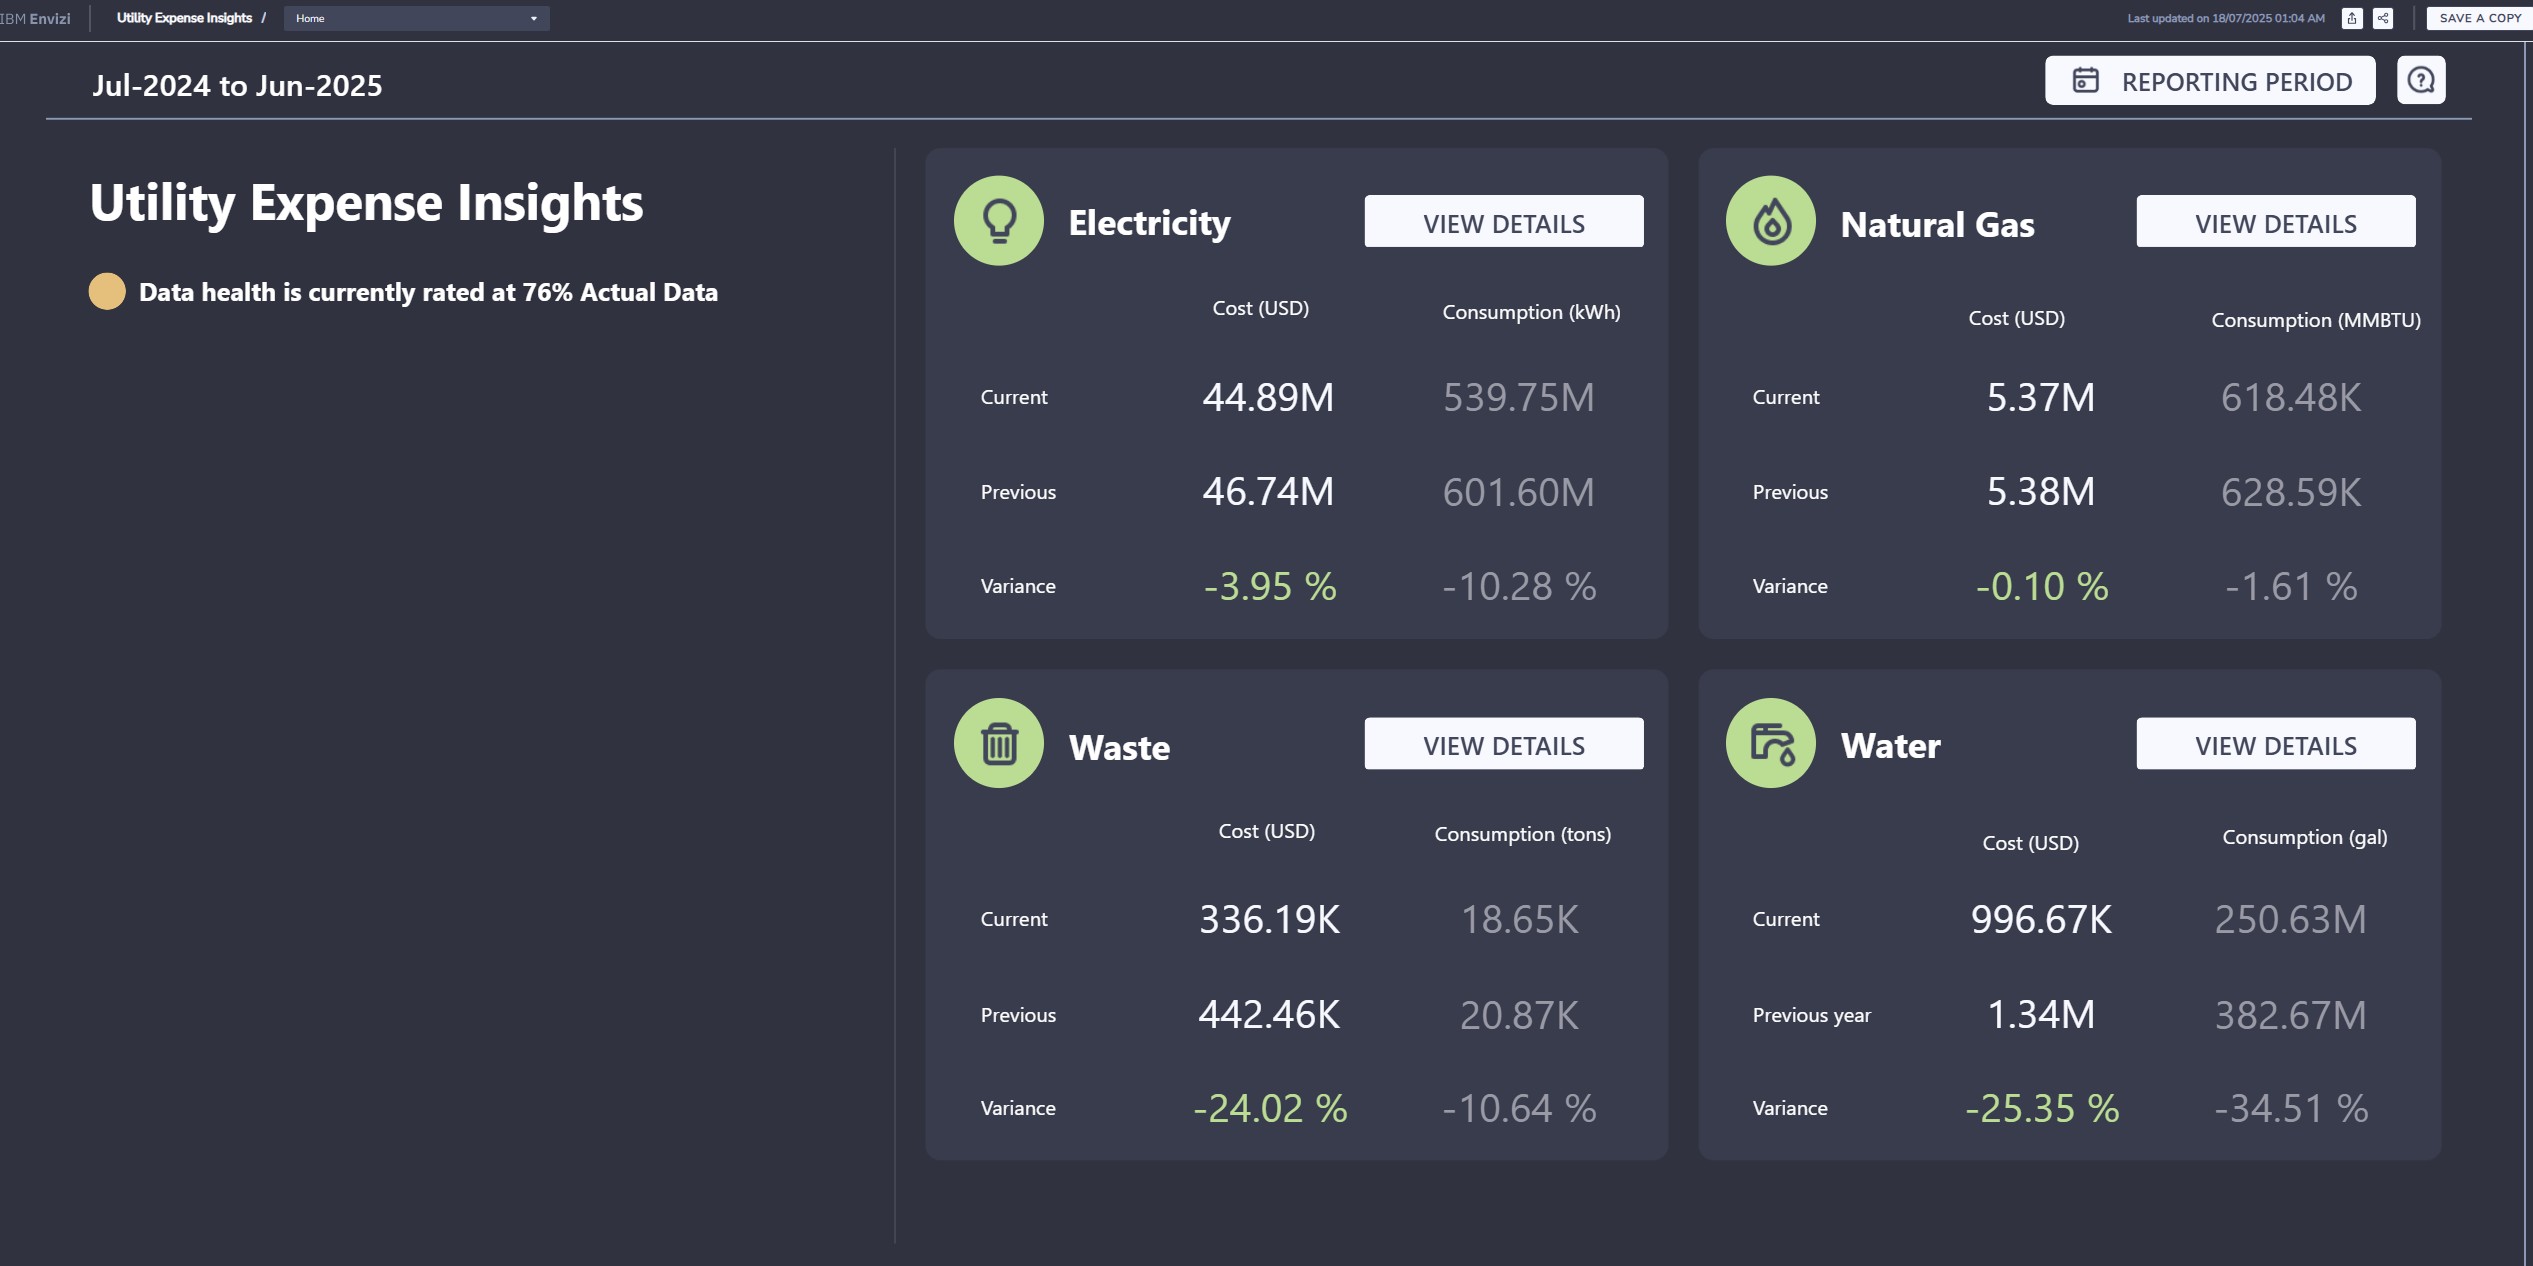
Utility Expense Insights, July 2024 to June 2025: electricity 44.89M USD (down 3.95%), natural gas 5.37M, waste 336K, water 997K. Data health: 76% actual.
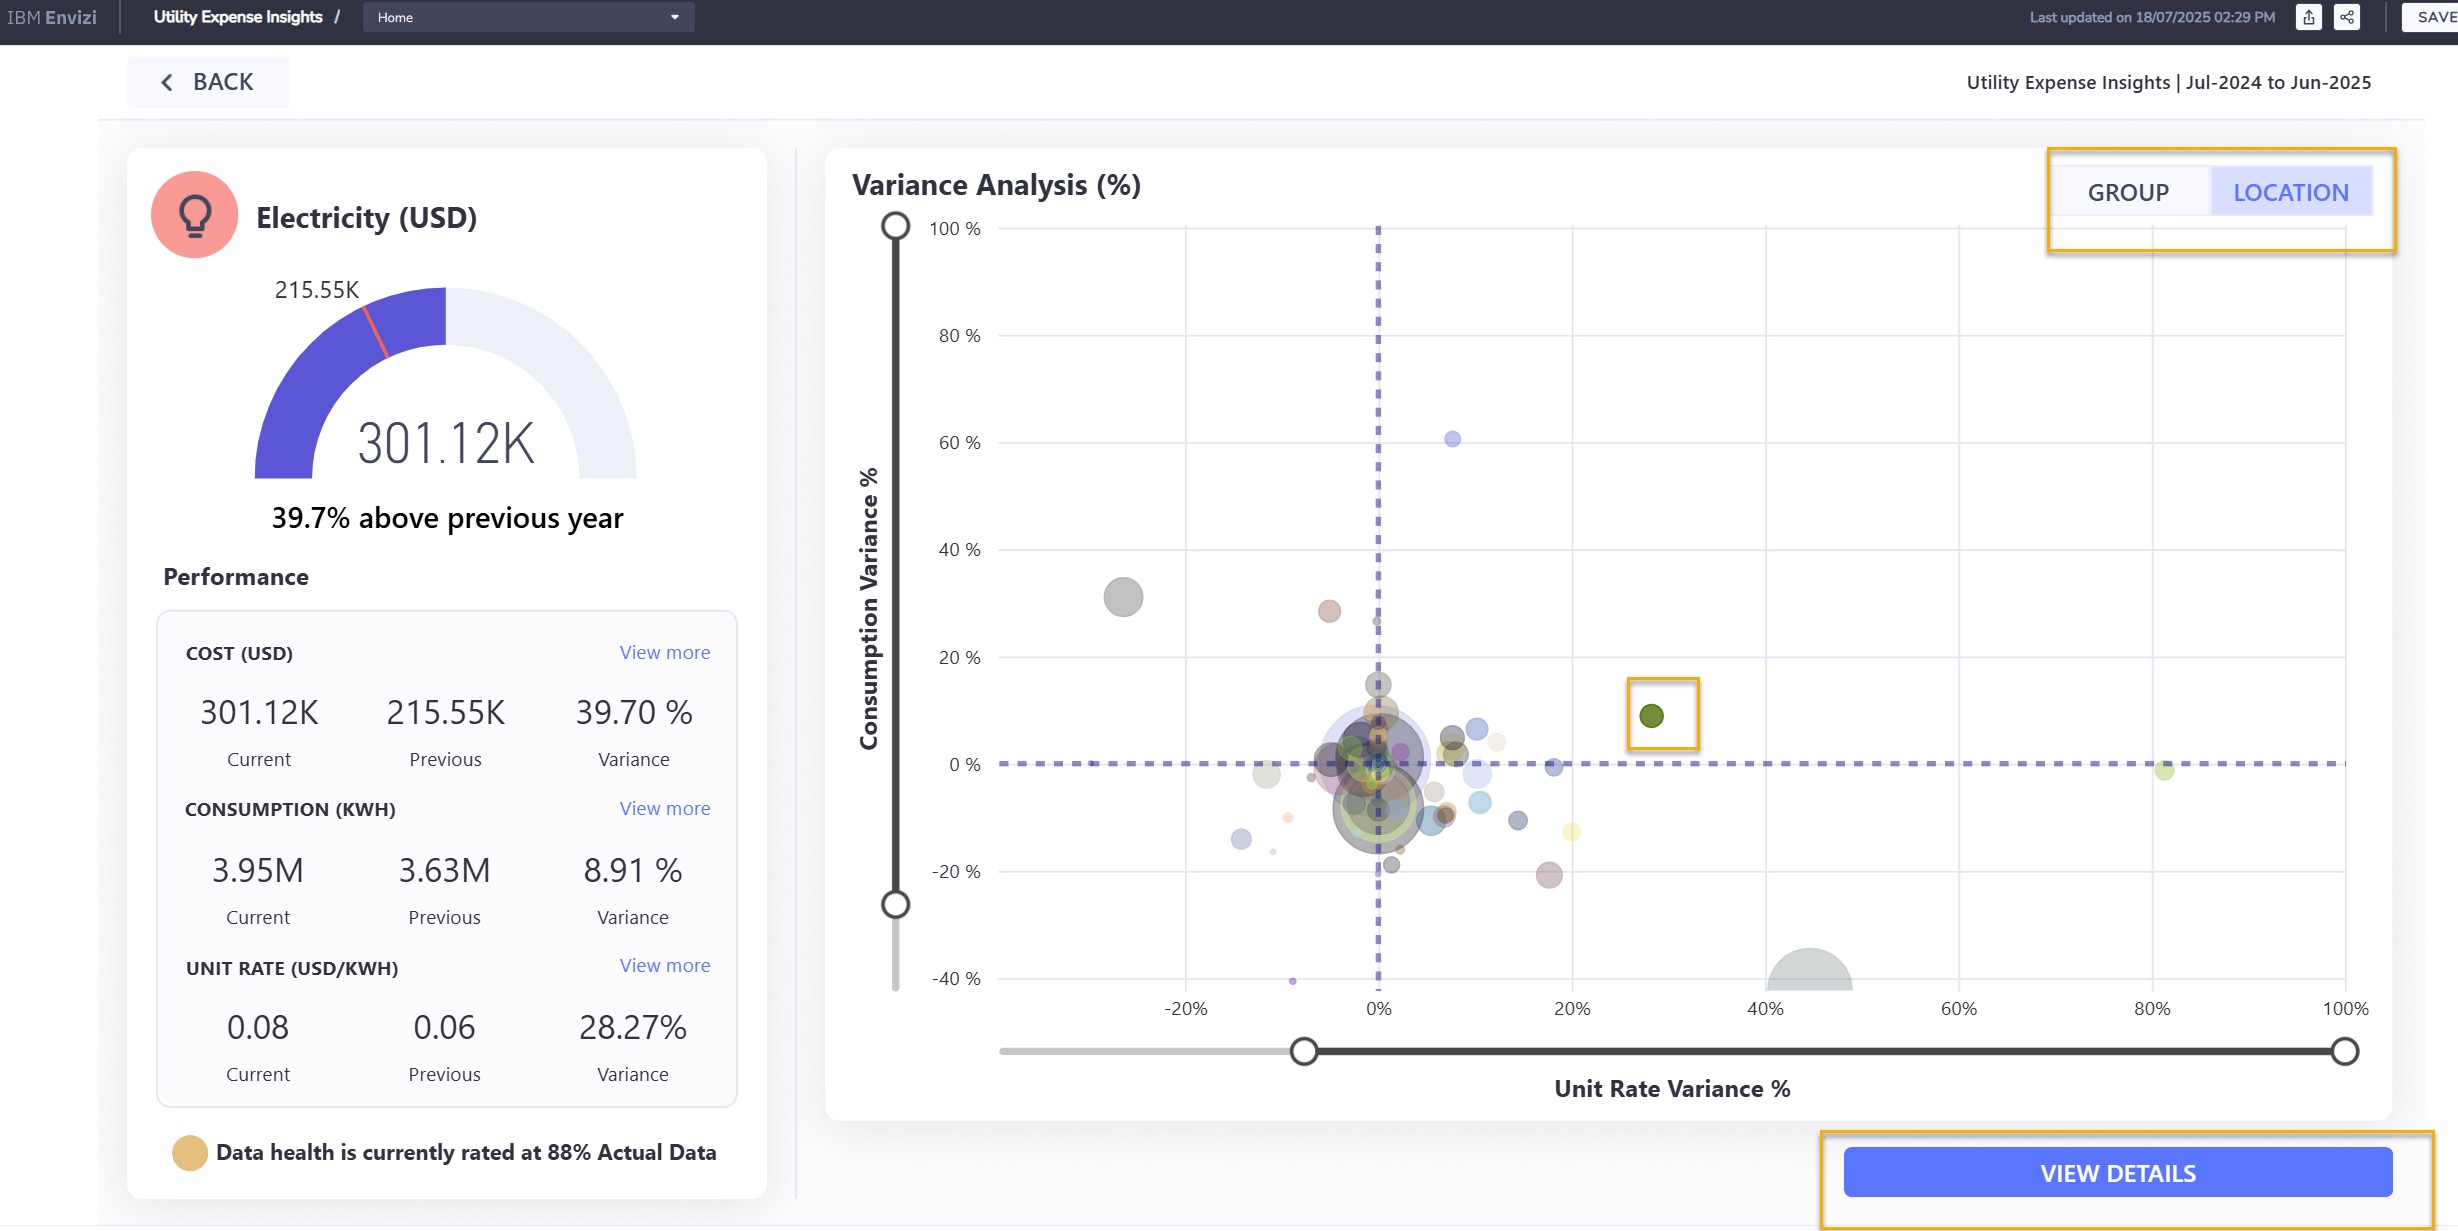
Variance analysis by location. One site: cost up 39.7% (301K against 216K USD).
Why did the bill go up? The page splits it: consumption +8.91%, unit rate +28.27%. And 1.0891 × 1.2827 = 1.397, the 39.7%. Most of this increase is price, not waste. That is a procurement conversation, not a maintenance one, and it takes one screen to know.
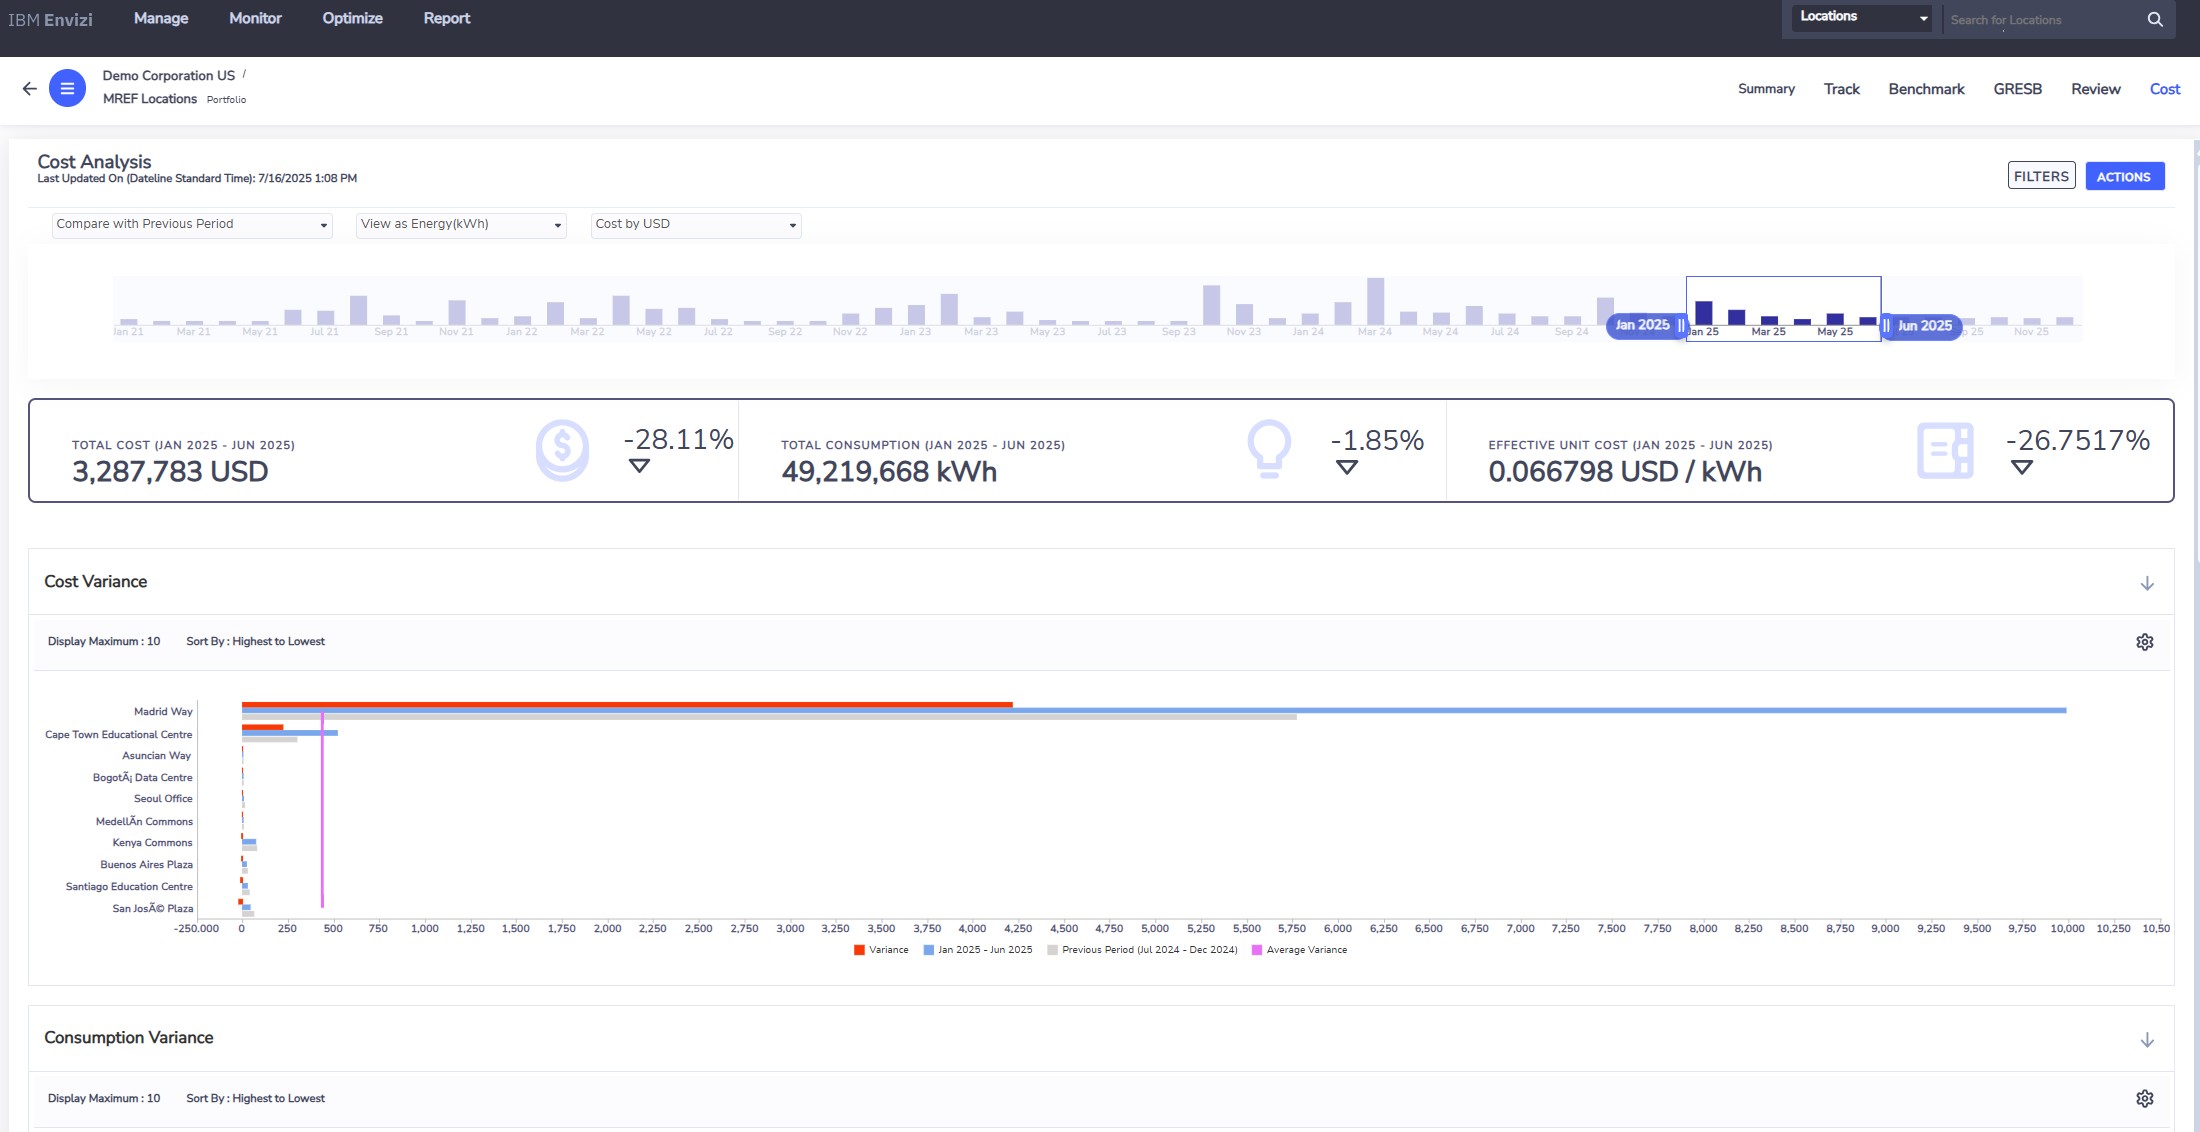
Cost analysis for a group of locations: 3.29M USD (down 28%), 49.2M kWh (down 1.85%), effective unit cost down 26.75%, then the sites ranked by variance.
9.2 Interval meters
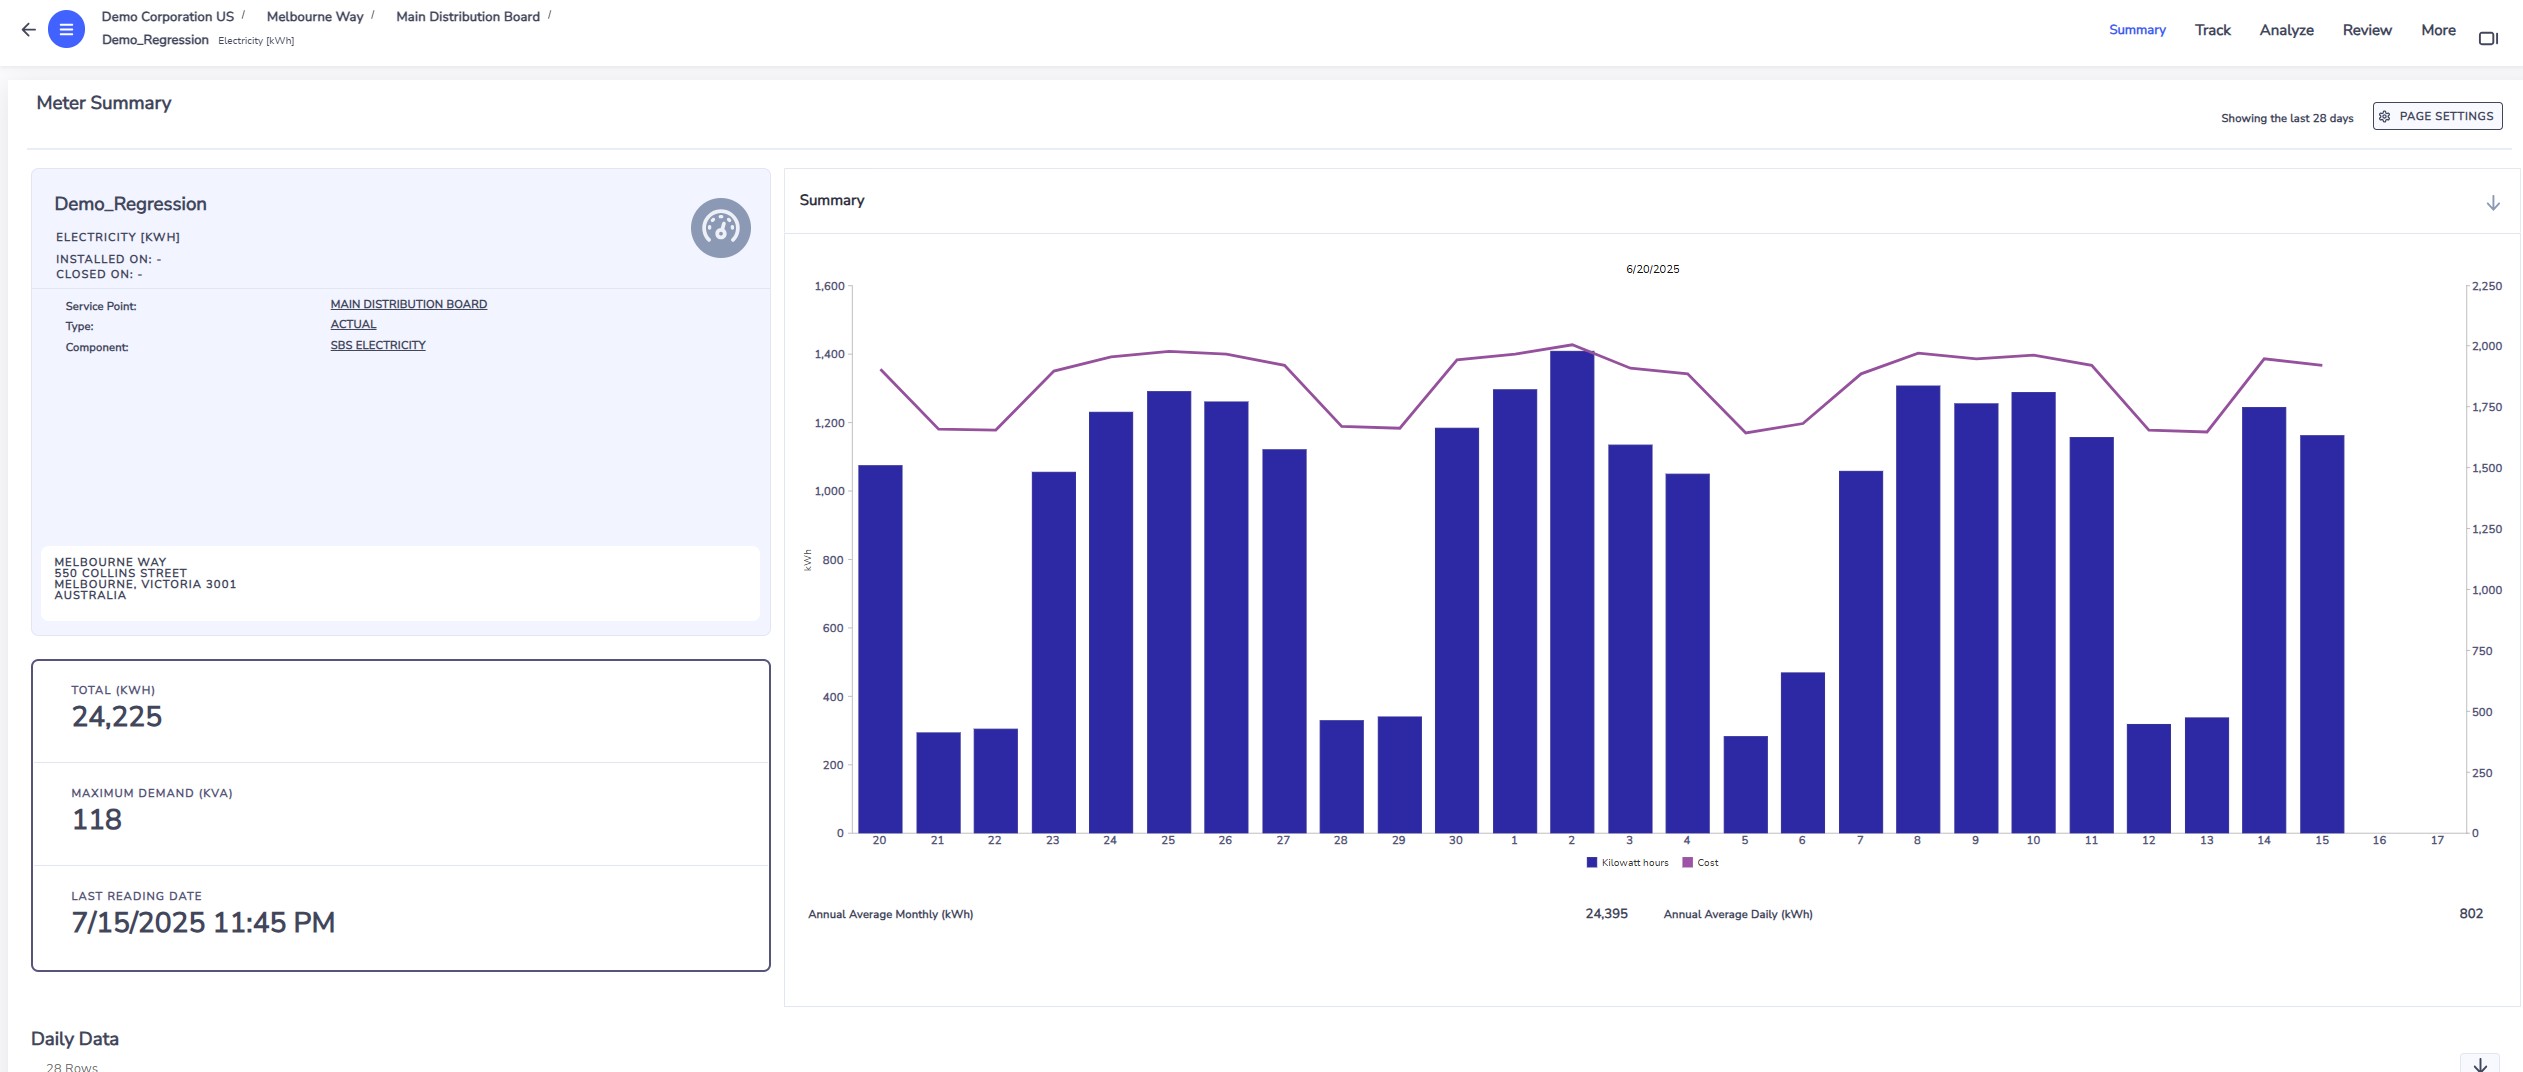
A main meter at Melbourne Way: 24,225 kWh in the last 30 days, maximum demand 118 kVA. Low bars are weekends.
Raw meter data is never clean. Envizi applies fixed rules before it reports anything:
- Invalid readings (empty, negative, duplicate, unknown meter) are discarded.
- Spikes: a reading more than ten times the average demand of the last 90 days is treated as missing.
- Short gaps inside a day are filled in a straight line.
- Gaps of a day or more are filled from the meter's own profile for the same weekday and similar weather.
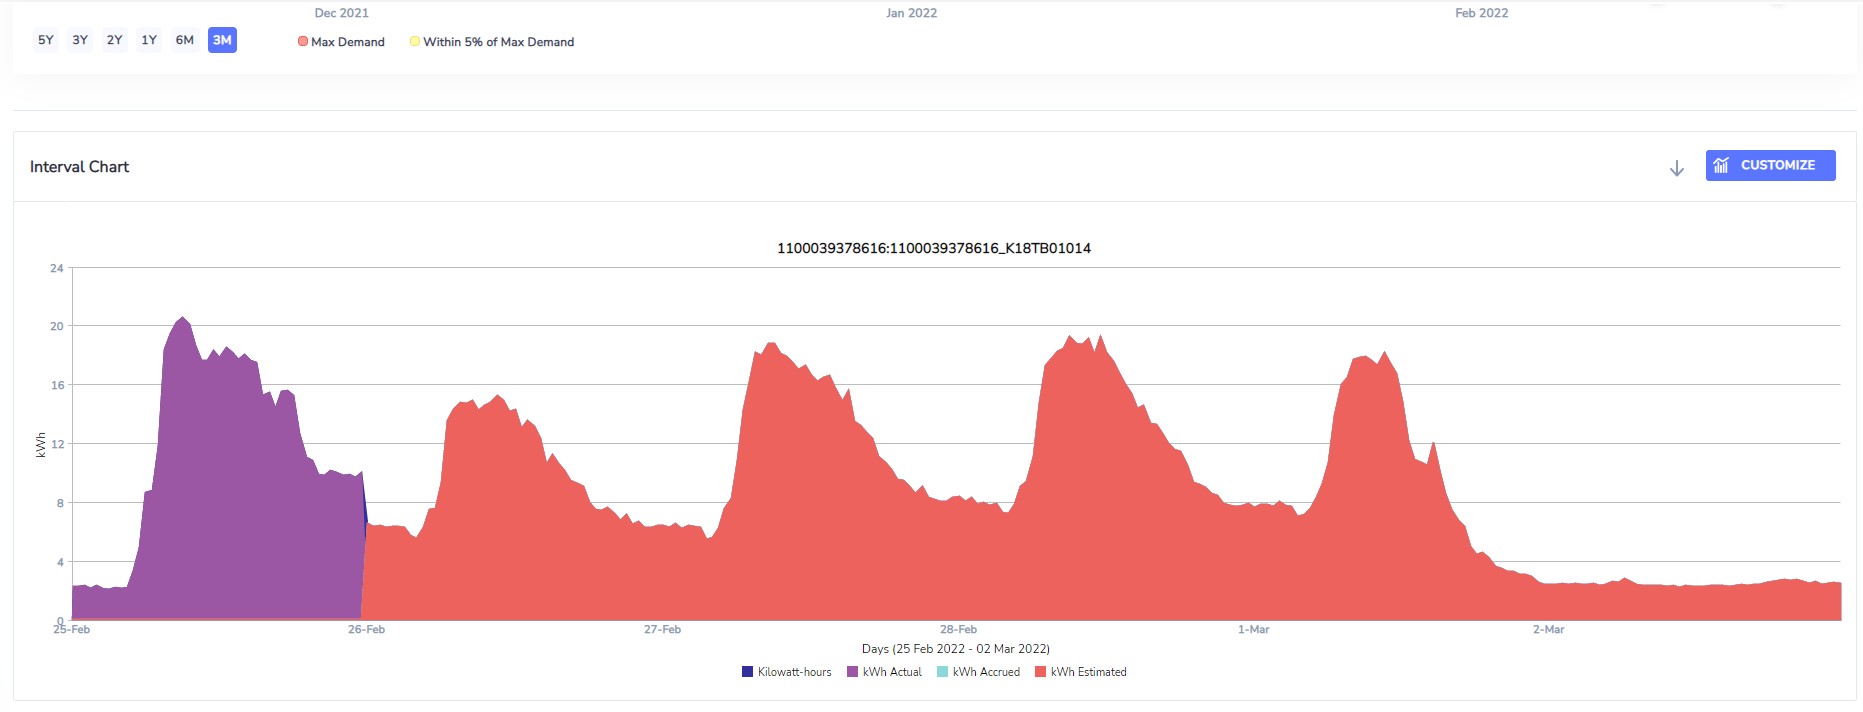
An interval chart with the status of each reading: actual, accrued or estimated. You always know which part of a curve was measured.
On clean data, the meter dashboards answer operating questions: the daily load profile, a week of profiles overlaid, a heat map that shows after-hours load at a glance, maximum demand events ranked, regression against weather, and actual against expected consumption.
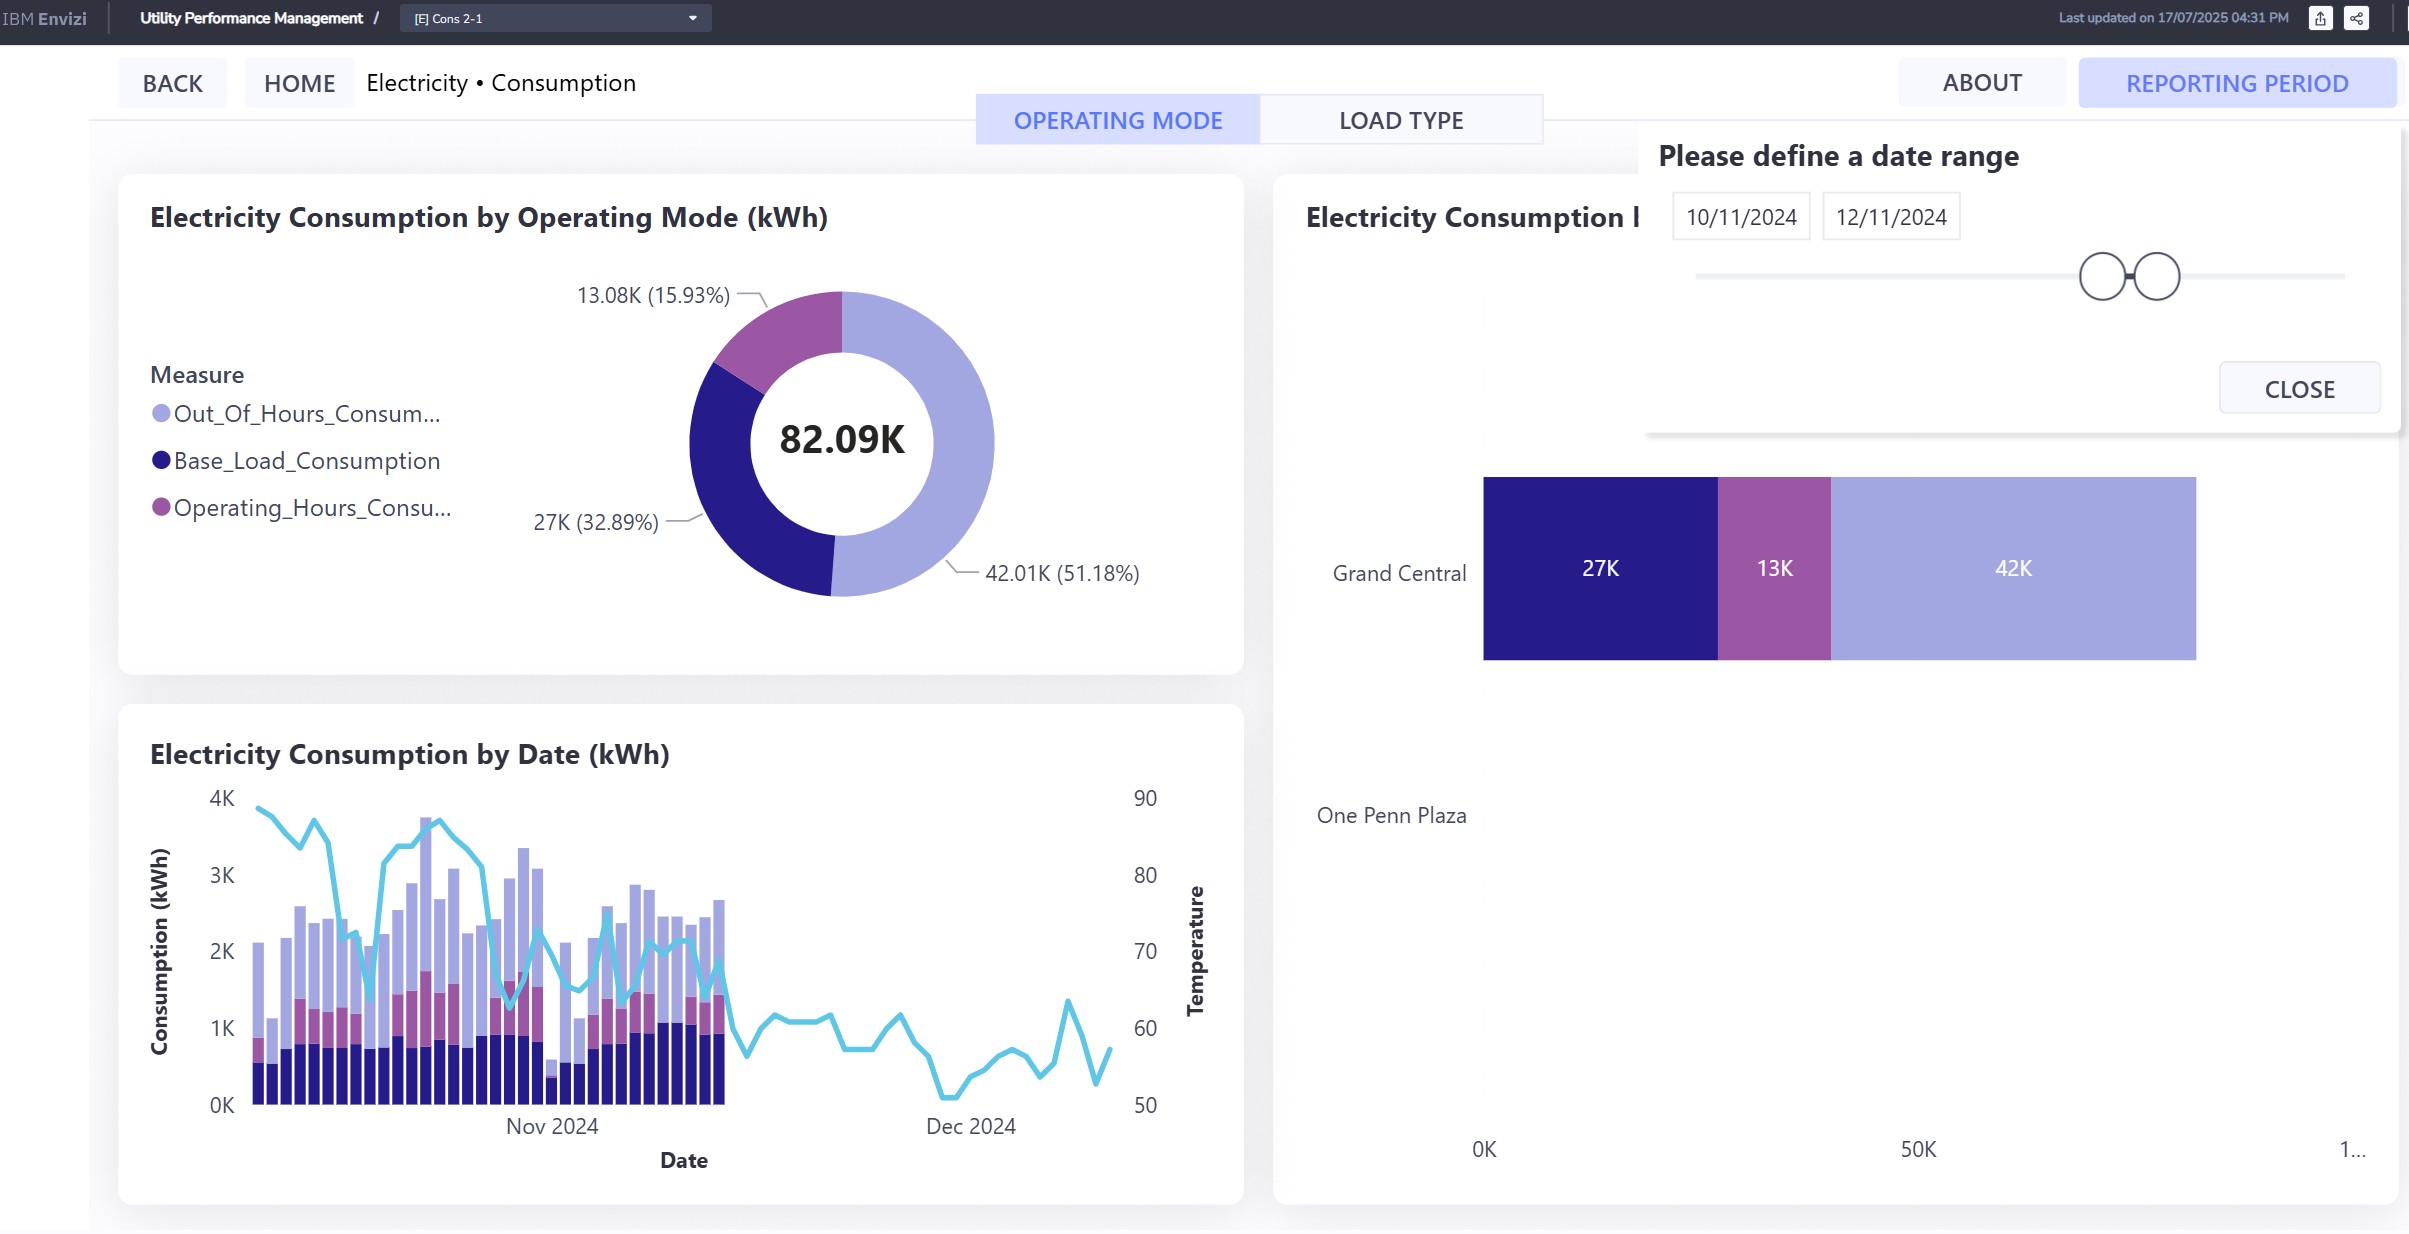
Utility Performance Management for one building: of 82.09 thousand kWh, 51% was used outside operating hours, 33% is base load and 16% falls in operating hours.
Read that again. Half of the electricity is used when the building is closed. No bill will ever show this. It is the single most useful thing interval data tells a facilities manager.
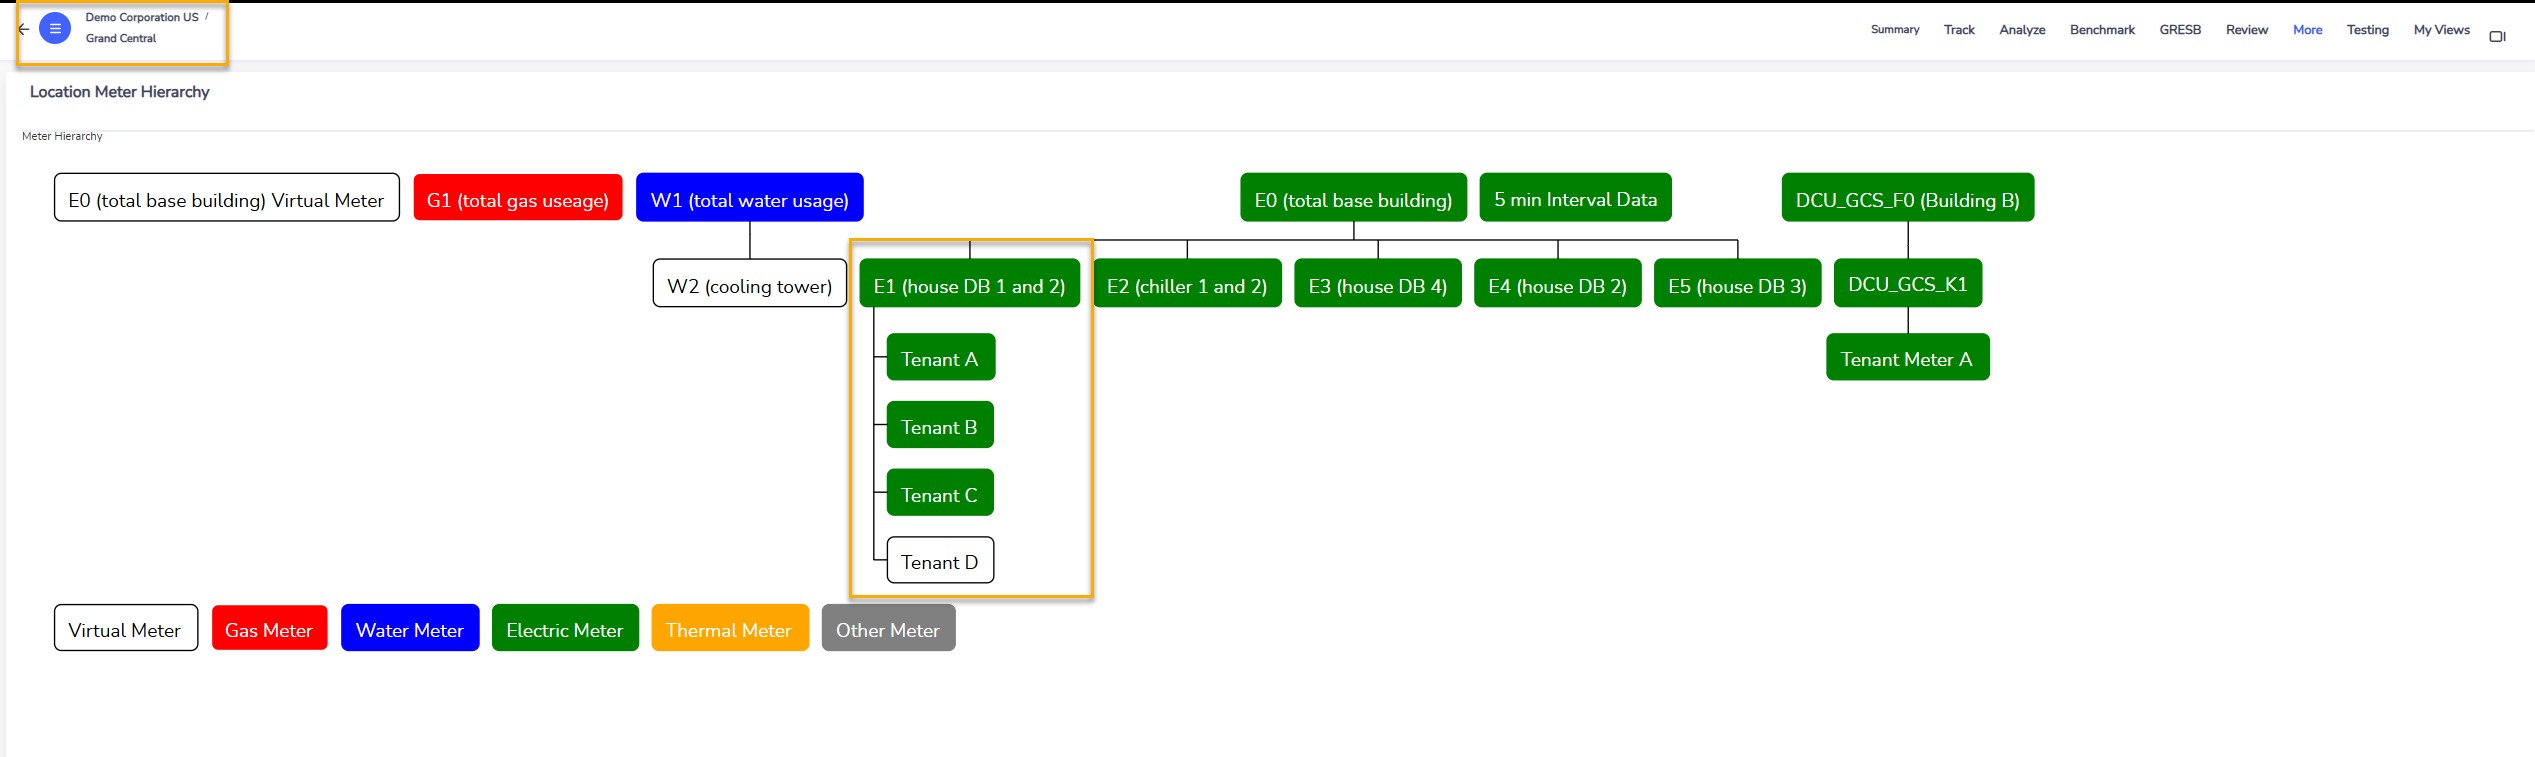
The meter hierarchy of Grand Central: gas, water and electricity main meters, the distribution boards under the main meter, and tenants under a board. 'Tenant D' has no meter: it is a virtual meter, the board minus tenants A, B and C.
Two more controls close the loop. A billed against metered report compares what the retailer invoiced with what the meter recorded for the same period. Meter alerts raise an issue and send an email when a feed goes quiet, when demand passes a fixed threshold (an HVAC plant starting too early), or when consumption departs from its usual pattern.
9.3 Did the upgrade work?
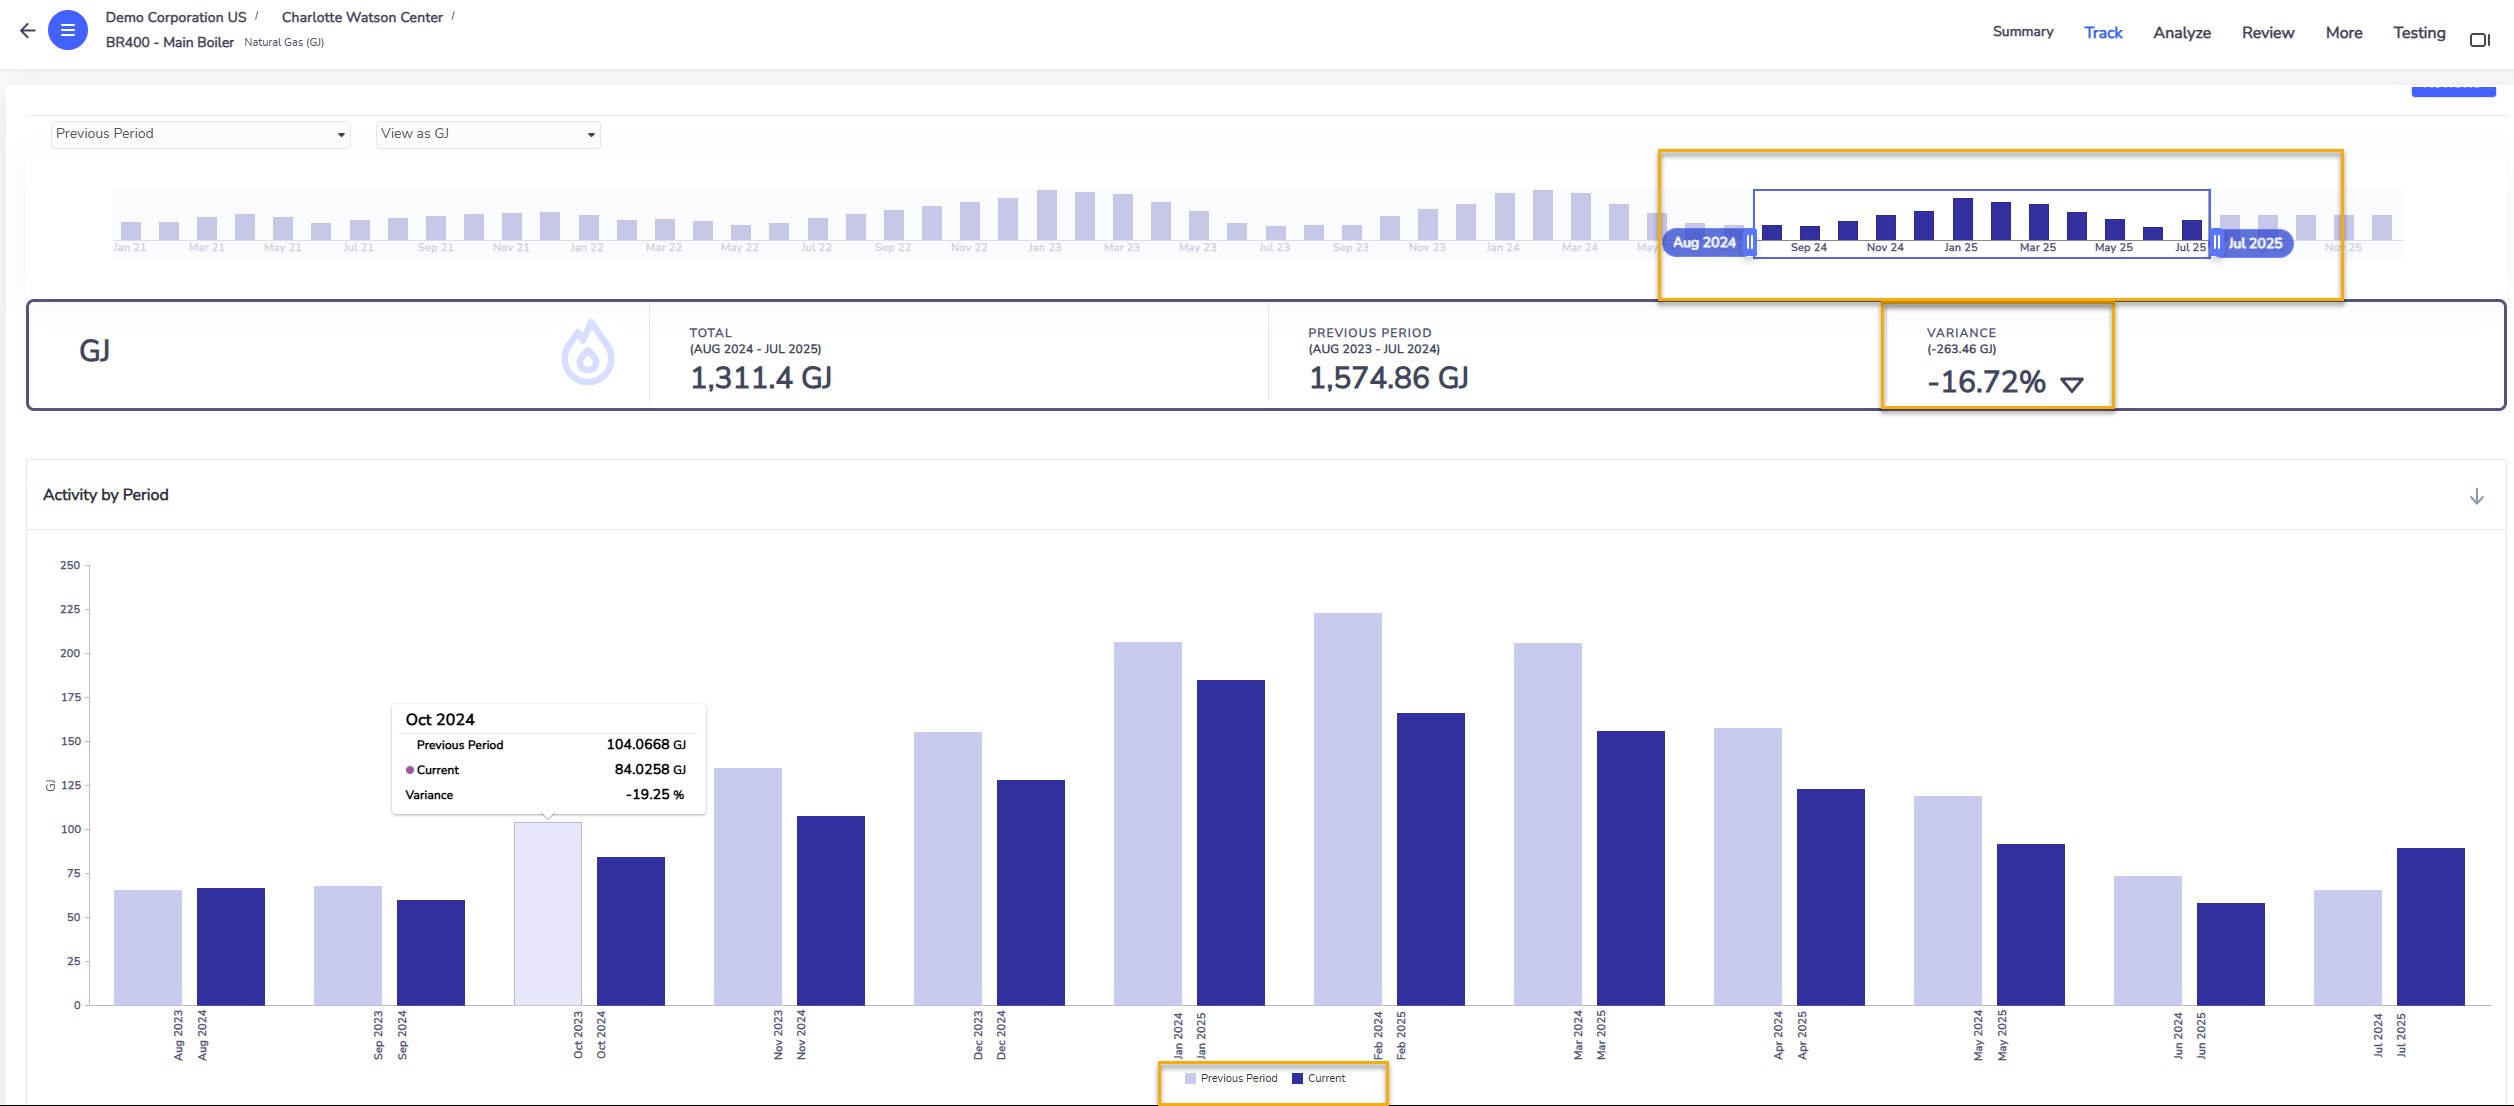
Main boiler, Charlotte Watson Center: 1,311 GJ of gas over twelve months against 1,575 GJ the year before, down 16.72%.
In Maximo terms
This is where the two systems meet. The asset system proposes the replacement (age, condition, a capital plan). The work is done as a work order. Envizi holds the before and after on the boiler's sub-meter or gas account, and so proves the saving that the business case promised. In section 7 that proof is the "actual saving" of an action.
10. Use case 6: plan the reduction
Reporting tells you where you are. A board wants to know where you will be in 2030, and what it costs to be somewhere better. Envizi does this with a planning module built on IBM Planning Analytics. The demo story follows a sustainability team that must propose a science-based target.
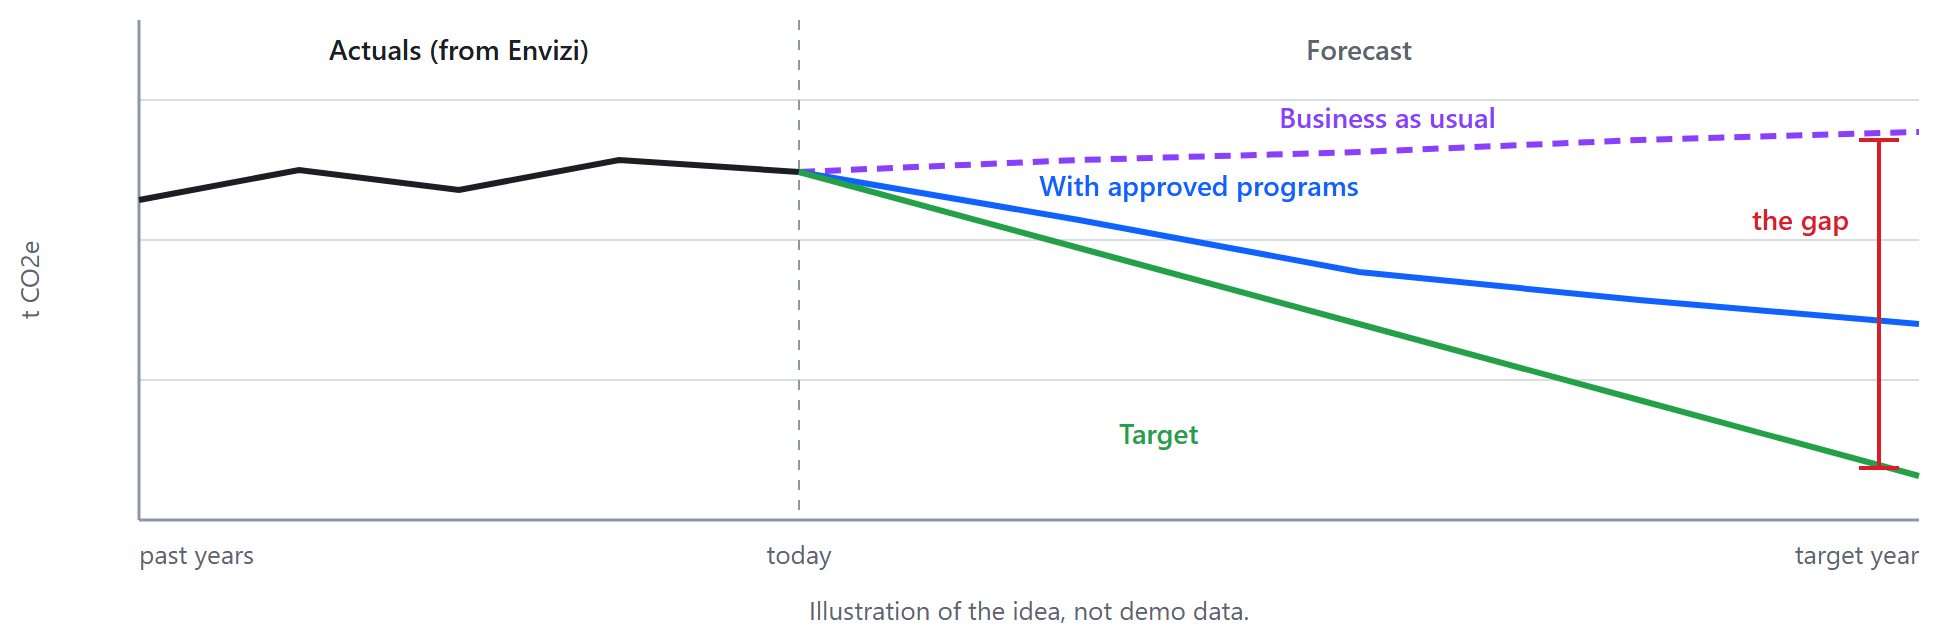
- Business as usual. The actuals come from Envizi and refresh daily. The team forecasts them forward, either from each series' own history, or with drivers such as production volume, floor area or headcount. This line is what happens if nothing is done.
- Target. Three ways to draw it: type the required value per year, draw a straight line down to a value in a target year, or write a rule ("minus 7% a year") that a table of percentages drives.
- The gap. A scenario page shows both lines and the distance between them, by site and by energy type. This is the size of the problem.
- Programs. The programs and actions of section 7 arrive in the planning workbook. For each action the team enters capital cost, running cost or saving, and tonnes avoided, month by month.
- Choose. A marginal abatement cost curve ranks the actions.
- Check and send back. Approved actions are applied to the baseline: a third line. If it still misses the target, more is needed. The agreed targets and programs are exported back into Envizi, where they are tracked against real data.
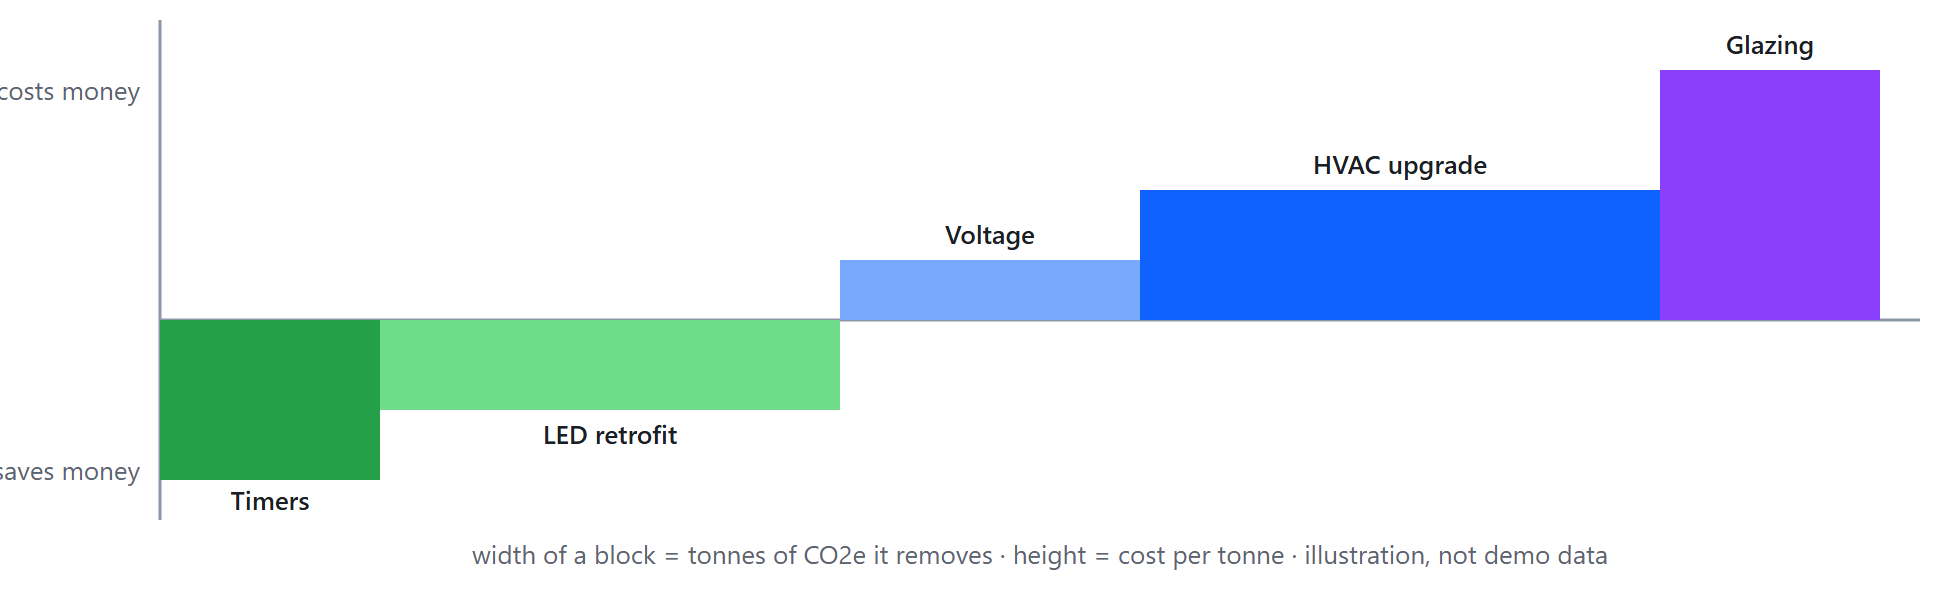
How to read the cost curve. Each block is one action. Blocks below the line pay for themselves; do those first. Wide blocks remove a lot of carbon. The expensive, narrow block on the right is the one to question.
I have not included screens for this use case: the source material's screenshots are not sharp enough to publish.
11. The suite, module by module
Envizi is licensed in modules. A customer buys the ones that match where they are, and the use cases above map to them.
| Module |
What it is for |
Seen in |
| Scope 1 and 2 GHG accounting and reporting |
Emissions from fuel and purchased energy, location-based and market-based, with managed factors and certificates |
4, 5 |
| Scope 3 GHG accounting and reporting |
All fifteen categories, all four methods, accuracy reporting |
5.3, 8 |
| Supply Chain Intelligence |
High-volume supplier and product data for category 1, supplier engagement |
8.1 |
| ESG reporting frameworks |
Answer several frameworks from one set of data |
6 |
| Surveys and assessments |
Collect quantitative and qualitative data from people inside or outside the company |
8.5 |
| Target setting and tracking |
Targets at any level of the hierarchy |
5.4 |
| Utility bill analytics |
Cost and consumption from invoices |
9.1 |
| Interval meter analytics |
High-resolution meter data, alerts |
9.2 |
| Building ratings and benchmarks |
ENERGY STAR, NABERS, GRESB |
4.2 |
| Sustainability program tracking |
Programs, action plans, actions, verified savings |
7 |
| Planning and forecasting |
Forecasts, scenarios, cost curves |
10 |
| Emissions API |
The calculation engine and factors as a service, for other applications |
|
12. Spotting a need
Four questions place a company on its journey:
- Do they already report to a framework (CDP, GRI, SASB, TCFD, GRESB, or ESRS under the CSRD)?
- Have they published a target?
- How is it done today: not at all, in spreadsheets, in another tool, or by a consultant?
- Are they still learning, or actively choosing software?
Before the first call, read their sustainability report. Search it for "Scope 3" and for the regulation of their region. What you find tells you which of these conversations to have:
| What you hear |
What to show |
| "The report takes us months and the auditors do not trust the spreadsheets." |
The data model, data health, disclosures (4, 6) |
| "A regulation now applies to us." |
Frameworks in the reporting manager, audit trail (6) |
| "Our Scope 3 is all spend-based and nobody believes it." |
The four methods and the accuracy page (8) |
| "Energy cost is up and we do not know why." |
Variance analysis, interval meters (9) |
| "We announced a target and have no plan." |
Business as usual, the gap, the cost curve (10) |
| "We run Maximo or TRIRIGA." |
The boiler: asset work proven by metered savings (9.3) |
13. Things to get right early
1. Account style. It decides unit, scope and factor. A gas account created with the wrong style gives a wrong footprint that looks perfectly healthy.
2. The region of a location. Electricity factors depend on the grid region. The Locations list shows a Factor Region column for a reason.
3. Accruals. A total that is 30% accrued is an estimate. Read the Actual / Accrued / Estimated split before you publish.
4. One location, several groups. Group totals overlap by design. Add up locations, not groups.
5. Net or gross, location-based or market-based. Disclosures ask for specific variants. Know which one a screen shows.
6. Changing a Scope 3 method. Moving a supplier from spend to a better method is progress, and it breaks the year-on-year comparison for that supplier. Note it when you publish.
7. Meter data without rules. One spike or one silent feed distorts a month. Agree the gap-filling and spike rules before anyone reads a dashboard.
14. Check yourself
Where does a monthly electricity bill go?
Answer: Into a record on an electricity account at the location that received the bill.
Business travel has no building. Where does it live?
Answer: In accounts under a corporate group or a virtual location, with a Scope 3 data type.
A manager asks "how sure are we of this number?" Which two things do you show?
Answer: The actual versus accrued split (data health), and for Scope 3 the calculation method behind each category.
What is the difference between a PowerReport and Emissions Performance?
Answer: A PowerReport is an embedded Power BI report that opens in its own tab. Emissions Performance is a native Envizi page that follows the hierarchy level you are on.
Your Scope 3 category 1 is 90% spend-based. What do you do first?
Answer: Find the few suppliers that make most of the number (the contributor dashboard), and move those to hybrid or supplier-specific data. Leave the long tail on spend.
You invested 20 million in a company whose equity and debt total 200 million and which emits 5,000 t. What are your financed emissions?
Answer: 5,000 × 20 ÷ 200 = 500 t CO2e.
An office has no meter and no bill. How can it be in the footprint?
Answer: With the average method: floor area × a published energy intensity for that building type, then the grid factor of its region. It is rated "fair", and replaced by actual data when that becomes available.
A site's electricity cost rose 40%. Which two numbers do you ask for?
Answer: The change in consumption and the change in unit rate. Their product explains the cost.
What is "business as usual" and why forecast it?
Answer: The emissions path if nothing changes. It is the line every target and every program is measured against.
Business value: who gains what
Emissions reporting looks like compliance. Done on one data foundation it also finds money.
| Who |
What changes for them |
How you would measure it |
| Sustainability leads |
Emissions figures built from source data with the evidence attached, in place of spreadsheets passed by email. |
Days to close a reporting period; data points without a source document. |
| Finance |
Utility bills are checked on the way in, so errors and unusual consumption surface early. |
Billing errors recovered; energy cost per site. |
| Facility and energy managers |
Targets and reduction projects are tracked against real consumption. |
Progress against target per site; projects with measured savings. |
| Auditors and assurance |
Every reported number can be traced to its account, meter and factor. |
Audit queries per report. |
| Executives |
Public commitments rest on numbers that can be defended. |
Restatements of previously reported figures. |
No figures are promised here. Record your own baseline for each measure before the change, and compare after one quarter.
15. Glossary
| ESG |
Environmental, social and governance. |
| GHG, CO2e |
Greenhouse gases; all of them expressed as the equivalent amount of carbon dioxide. |
| GHG Protocol |
The accounting standard behind Scope 1, 2 and 3. |
| Emission factor |
CO2e per unit of activity: per kWh, per litre, per dollar. |
| EEIO |
Environmentally extended input-output: a database of emissions per dollar by industry, used for spend. |
| Product carbon footprint |
A supplier's own figure for one product, from a life cycle analysis. |
| Accrual |
An estimate that fills a missing period so totals stay complete. |
| Virtual account, virtual meter |
One calculated from others by a rule. |
| PCAF |
Partnership for Carbon Accounting Financials: the standard for financed emissions. |
| Interval data |
Meter readings every few minutes, as opposed to a monthly bill. |
| Maximum demand |
The highest rate of use in a period; often billed separately. |
| Business as usual |
The forecast with no new action. |
| SBTi |
Science Based Targets initiative: validates that a target matches climate science. |
| Marginal abatement cost curve |
Actions ranked by cost per tonne avoided. |
| CSRD, ESRS |
The EU reporting directive and its standards. |
| CDP, GRI, SASB, TCFD, ISSB |
Reporting frameworks and standards a disclosure may follow. |
| GRESB, ENERGY STAR, NABERS |
Building and real-estate ratings. |