Introduction
Organizations today face the challenge of deriving insights from data that is distributed across multiple systems — such as object storage, data warehouses, and operational databases. At the same time, they must balance cost efficiency, governance, and scalability, while avoiding unnecessary data duplication and increasingly complex data pipelines. These challenges becomes even more complex when working with geospatial and time‑series data, where volume, variety, and data quality issues quickly multiply. At the same time, organizations must balance cost efficiency, governance, and scalability, while avoiding unnecessary data duplication and increasingly complex data pipelines.
This watsonx.data demo illustrates how enterprises can address these challenges using a modern lakehouse approach. Rather than moving data into a central system, watsonx.data enables teams to analyze data where it already resides, integrating multiple sources through a unified semantic and governance layer. A key message of this demo is to show the combined value of all three watsonx.data building blocks:
-
watsonx.data Integration for ingesting and preparing heterogeneous data (including semi‑structured and JSON‑based geospatial data)
-
watsonx.data Lakehouse for zero‑copy analytics across object storage and databases using Spark and Presto
-
watsonx.data Intelligence for profiling, enrichment, and data quality governance directly on lakehouse data
From a business perspective, the demo highlights how organizations can:
-
Enable geo‑aware and context‑rich analytics on existing data assets
-
Reduce time‑to‑insight by enabling fast, SQL‑based analytics across systems
-
Lower infrastructure and operational costs through zero‑copy data access
-
Maintain control over data quality, metadata, and compliance
-
Empower different roles—from analysts to data engineers—using the same platform
Beyond the demo itself, this document is designed to serve as a reusable blueprint:
-
A reference implementation to recreate a similar watsonx.data setup
-
A starting point that can easily be adapted to different data landscapes
-
A foundation for extending the architecture to other use cases, data sources, or analytical scenarios
The following sections walk through a realistic end‑to‑end scenario from data ingestion to analytics and enrichment, showing how watsonx.data transforms distributed data landscapes into a governed, analytics‑ready foundation for decision-making.
Note: You can find the data, Python notebook for Apache Spark, and SQL query for Presto in this GitHub repository https://github.ibm.com/dennis-treder-tschechlov/watsonx-data-demo-self-driving-cars
Use Case & Data
Use Case
This demo was built as a custom technical demo for a customer in the self‑driving car domain, serving as a concrete example of how geospatial, time‑series, and contextual data can be processed and analyzed in watsonx.data. The objective was to show how heterogeneous datasets from autonomous driving systems can be ingested into a central lakehouse and then enriched, profiled, and monitored using watsonx.data intelligence. Further, besides demonstrating lakehouse analytics, we specifically to showcase how geo‑spatial data from autonomous driving systems can be:
-
Integrated from multiple sources
-
Analyzed across storage and database systems
-
Enriched and validated using contextual reference data
-
Monitored using profiling and data quality rules
From a technical perspective, the focus was on:
-
Integrating multiple data sources stored in cloud object storage and Db2
-
Handling different data formats (structured telemetry and semi‑structured geospatial data)
-
Demonstrating data quality and enrichment workflows on top of raw data
The automotive domain provided realistic telemetry patterns and data quality challenges that map well to typical lakehouse scenarios. While the automotive domain serves as a realistic scenario, the underlying patterns—geo‑intelligence, time‑series analytics, and data quality monitoring—are applicable across others industries as well.
Data Description
Data Overview
The demo is based on four datasets that represent different aspects of autonomous driving data:
-
Vehicle telemetry data as the core time‑series dataset
-
Street sign data as semi‑structured reference data
-
Weather data as contextual information
-
Road incidents stored in a relational database
|
|
|
|
Key Attributes (examples)
|
|
|
Vehicle Telemetry
|
Structured, time‑series
(CSV)
|
COS
|
vehicle_id, timestamp, lat/lon, speed_kph, perceived_speed_limit, confidence
|
Core dataset; analytics, quality checks, enrichment
|
|
Street Signs
|
Semi‑structured (GeoJSON)
|
COS
|
sign_id, geometry, sign_type, speed_limit
|
Reference data for enrichment & validation
|
|
Weather
|
Structured, time‑series
(CSV)
|
COS
|
timestamp, condition, rain_mm, visibility_m
|
Context data for correlation
|
|
Road Incidents
|
Structured, relational
(CSV)
|
Db2
|
incident_id, timestamp, location, incident_type, reported_speed
|
Cross‑source analytics & correlation
|
Together, these datasets are used to demonstrate cross‑source analytics, enrichment, and data quality workflows in watsonx.data.
Vehicle Telemetry Data
The primary dataset represents vehicle telemetry generated by self‑driving cars. Each record captures a single observation at a given timestamp. It simulates high‑volume, time‑series data typically produced by onboard perception and localization systems.
To support the data quality part of the demo, we intentionally introduced:
-
Mismatches between actual speed and perceived speed limit
-
Differences between perceived speed limits and ground‑truth road signs
-
Outliers in speed and confidence values
These issues are later used to demonstrate profiling, anomaly detection, and rule‑based data quality checks in watsonx.data intelligence.
Street Sign Data (GeoJSON)
To demonstrate integration of non‑tabular data, we added a street sign dataset in JSON / GeoJSON format. The street sign data acts as a reference dataset that can be joined with vehicle telemetry for enrichment and validation, for example to compare perceived versus actual speed limits based on location.
Road Incidents
We also used a dataset about road incidents. This can be used to join with the weather dataset to check the weather condition and if the incident is really related to the weather.
Synthetic Data Generation
All datasets were synthetically generated using an LLM. This allowed us to control schemas, value distributions, and error patterns while avoiding the use of real customer data, and to reliably demonstrate profiling, rule‑based checks, and metadata enrichment later in the demo. This approach also ensures that the demo setup can be easily replicated or adapted to other use cases.
Architecture
In the following section, we describe the architecture of the watsonx.data demo environment. The setup is designed to showcase how heterogeneous data sources can be integrated, governed, and consumed using a lakehouse approach, while leveraging multiple query and processing engines.
The overall architecture consists of four main layers:
-
Data Sources (local data, cloud object storage, and database)
-
watsonx.data Integration
-
watsonx.data Lakehouse
-
watsonx.data Intelligence
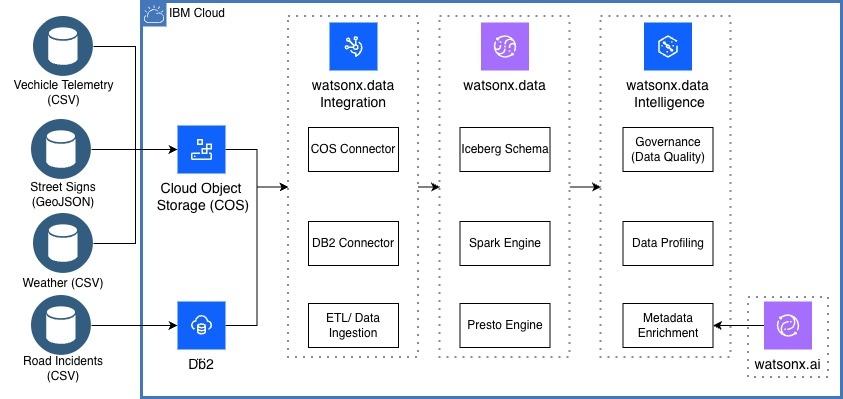
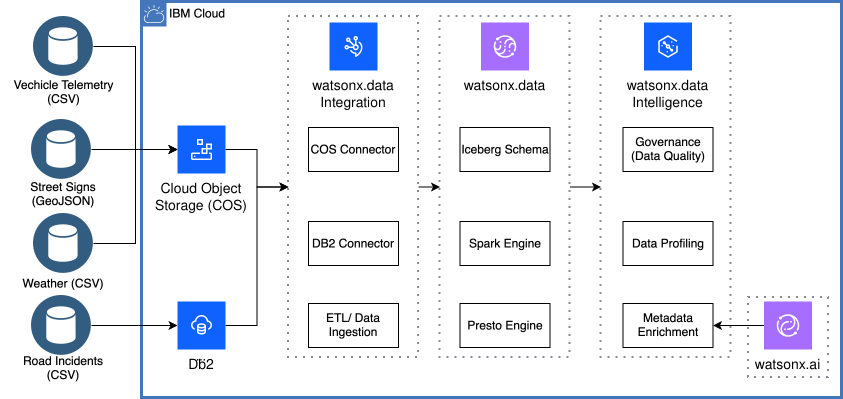
Data Sources
For the demo, multiple data sources were used to reflect a realistic enterprise scenario:
-
Local data files
The datasets (e.g. vehicle_telemetry.csv, weather.csv, road_incidents.csv, and street_signs.json) were generated locally. Generative AI (genAI) was used to synthesize domain-specific data tailored to the demo use case.
-
Cloud Object Storage (COS)
The local datasets are uploaded to IBM Cloud Object Storage (COS), which is an S3-compatible object storage service. In real customer scenarios, COS represents the primary landing zone and starting point for analytical workloads.
-
IBM Db2
In addition to object storage, an IBM Db2 database is integrated to demonstrate that watsonx.data can federate and query structured relational data, even when it resides in a separate database system.
Although COS and Db2 are used in this demo, the architecture can easily be extended to additional data sources such as other object stores, databases, or streaming platforms.
watsonx.data Integration
Data ingestion and access is handled by watsonx.data Integration, which provides connectors and data integration capabilities for heterogeneous sources. watsonx.data integration is used for connectivity and optional ETL. It provides:
-
Connectors (e.g. COS, Db2)
-
Data ingestion and transformation pipelines (Data Stage, Spark, …)
In real scenarios, it prepares data for analytics but is not responsible for querying.
Note: For simple data ingestion and connection to COS/Db2 you won’t need data integration. It can be used for more complex Bulk/Batch jobs using ETL pipelines or for streaming scenarios.
watsonx.data Lakehouse
Zero-Copy / Iceberg Schema
-
The data remains in its original location (COS, Db2).
-
No physical data movement into watsonx.data.
-
Apache Iceberg schemas describe structure, partitions, and metadata.
-
Engines query data directly via the Iceberg catalog.
-
Especially relevant for large datasets and streaming scenarios.
Query Engines
-
Presto
-
Apache Spark
-
Batch processing, ETL, advanced analytics, ML
-
Available as standard Spark and optimized Spark with Gluten
watsonx.data Intelligence
watsonx.data Intelligence adds:
-
Data quality checks
-
Data profiling
-
Metadata enrichment
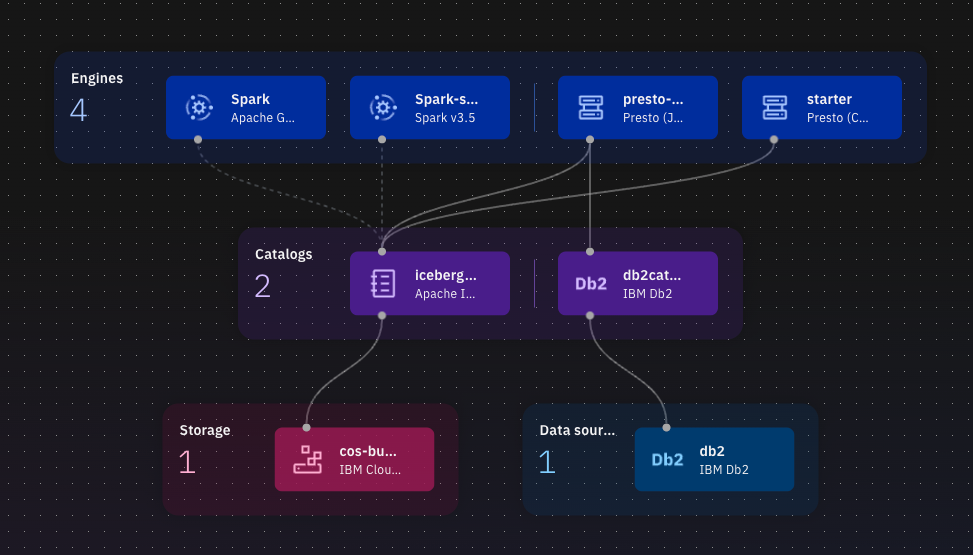
After processing the steps below, the result in watsonx.data should look like this:
Data Ingestion
As described above, we used synthetically generated data for the demo. The data was uploaded to Cloud Object Storage (COS) and IBM Db2 and then ingested into watsonx.data for analytics.
Ingesting Data to from Cloud Object Storage (COS)
Cloud Object Storage is S3-compatible and was a mandatory requirement of the customer. In a real-world setup, COS typically represents the primary landing zone for analytical data.
Note: If you want to create a new bucket you might face problems configuring it with watsonx.data because you need an access and a secret key. To create them for a new bucket, you need the Secrets Manager service in IBM Cloud. However, you do not have the permissions within TZ To create one.
1. Upload to COS
-
Upload the data to the COS bucket in IBM Cloud. Go to ☰ Resource list → Storage → “[YOUR COS SERVICE INSTANCE]”
-
select the bucket you want to connect to watsonx.data.
-
Click on it and upload the data.
Note: Creating a new COS bucket may require access and secret keys. Generating these keys requires IBM Cloud Secrets Manager, which was not available in the current tenant (TZ). Therefore, an existing bucket was reused.
2. Connect to watsonx.data
-
Open the watsonx.data console
-
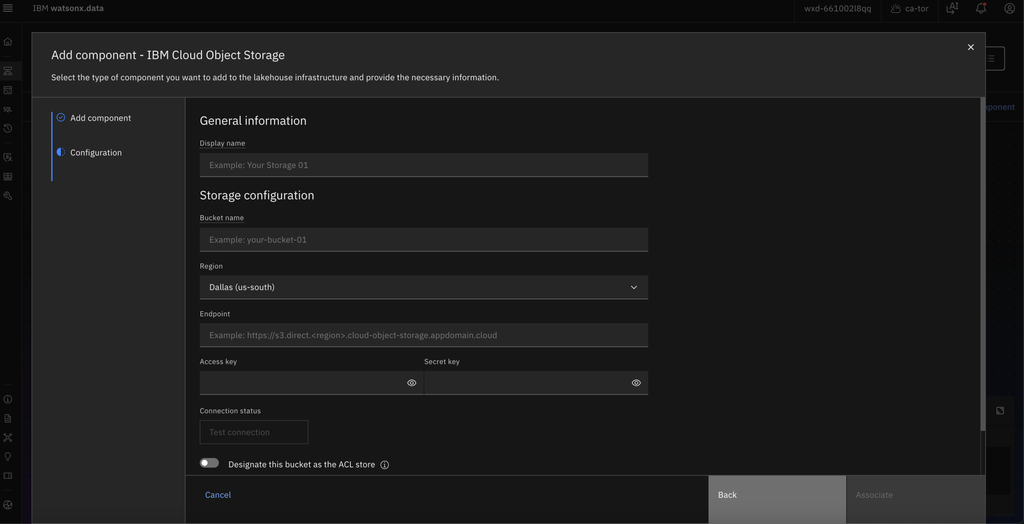
Go to ☰ Infrastructure → Add component
-
Select Cloud Object Storage
-
Provide:
-
Access key
-
Secret key
-
Endpoint (available in IBM Cloud under ☰ Resource list → Storage → “[YOUR COS SERVICE INSTANCE]” → Service Credentials)
-
You can retrieve the credentials from the COS service in IBM Cloud and then on the “Service credentials” tab. Open the appropriate service credential for your bucket
3. Create a Catalog
-
In ☰ Infrastructure Manager, hover over the COS storage and select Add catalog
-
Associate the catalog with an engine via Manage associations
-
A Spark engine is required for the ingestion step (the engine may restart after association)
4. Ingest Data
-
Go to ☰ Data Manager → Ingest data
-
Select Storage and choose the COS bucket
-
Start the ingestion job
-
Once completed, schemas and tables are visible in the Data Manager.
Ingesting Data from DB2
1. Upload Data to DB2
-
In IBM Cloud, select the Db2 service instance
-
Access the Db2 UI using credentials from Service Credentials
(not the IBM Cloud user ID)
-
Navigate to Data → Load Data
-
Upload the CSV file
-
Verify the upload by running a simple SQL query, e.g. SELECT * FROM ROADINCIDENTS;
Note: To login to DB2 UI, you need have to go to service credentials for the DB2 service, open the existing service credential and take the username and password from there. NOT YOUR IBM ID that you use for IBM cloud!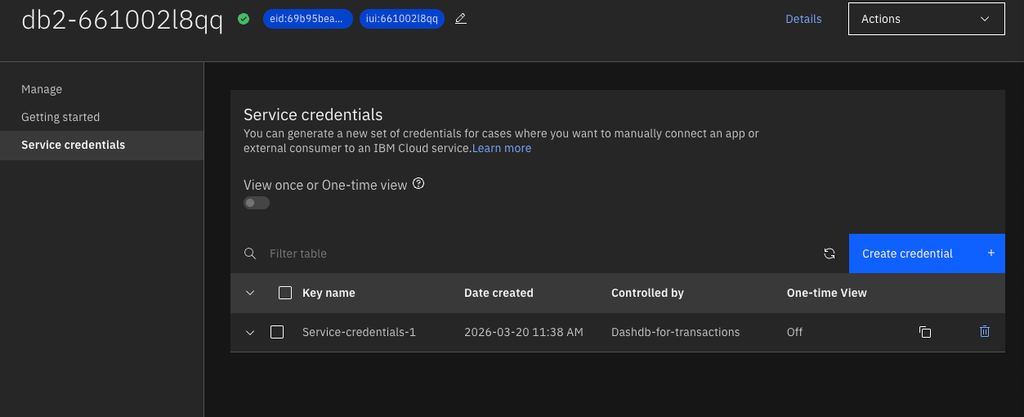
2. Connect DB2 to watsonx.data
-
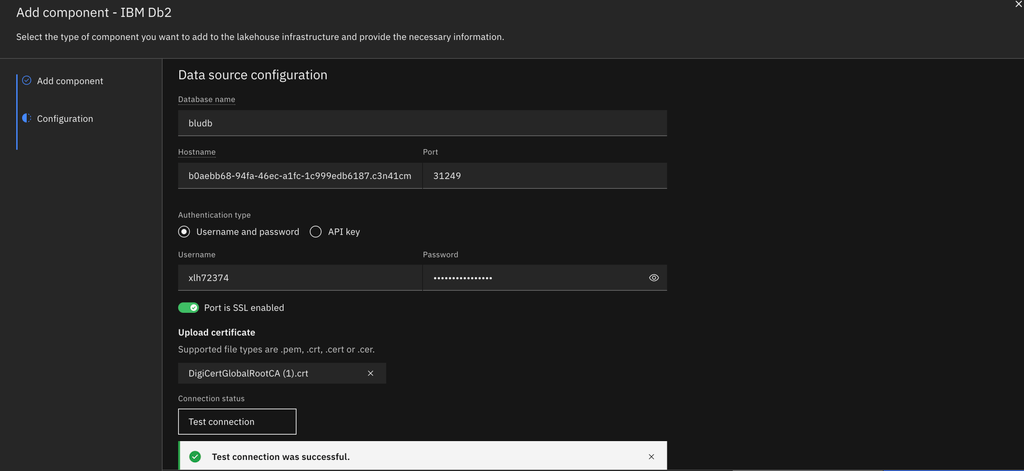
In the watsonx.data console, select Add component → IBM Db2
(not Db2 Warehouse)
-
Retrieve connection details from the Db2 Configuration page
-
Enable SSL and upload the required SSL certificate
3. Create Catalog and Ingest Table
-
In the ☰ Infrastructure view, add a new catalog for Db2
-
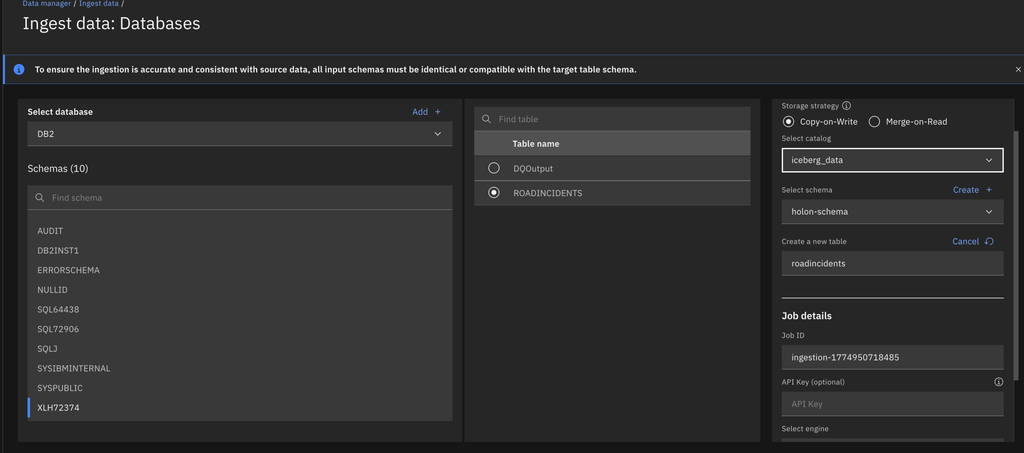
Go to ☰ Data Manager → Ingest data
-
Select Databases, choose the Db2 table, and assign it to the existing catalog
Now we are ready to query the data from the COS bucket and DB2 with our Presto and Spark engines.
Querying Data with Presto and Spark
Presto
Presto is used as the primary SQL engine for interactive analytics across all registered data sources.
Exploring Tables
-
In the watsonx.data console, open the ☰ Query Workspace
-
Tables from the configured catalog and schema are listed on the left
-
Clicking on a table (e.g. road_incidents) automatically generates a SQL query in the form:
-
Executing the query directly returns the result set:
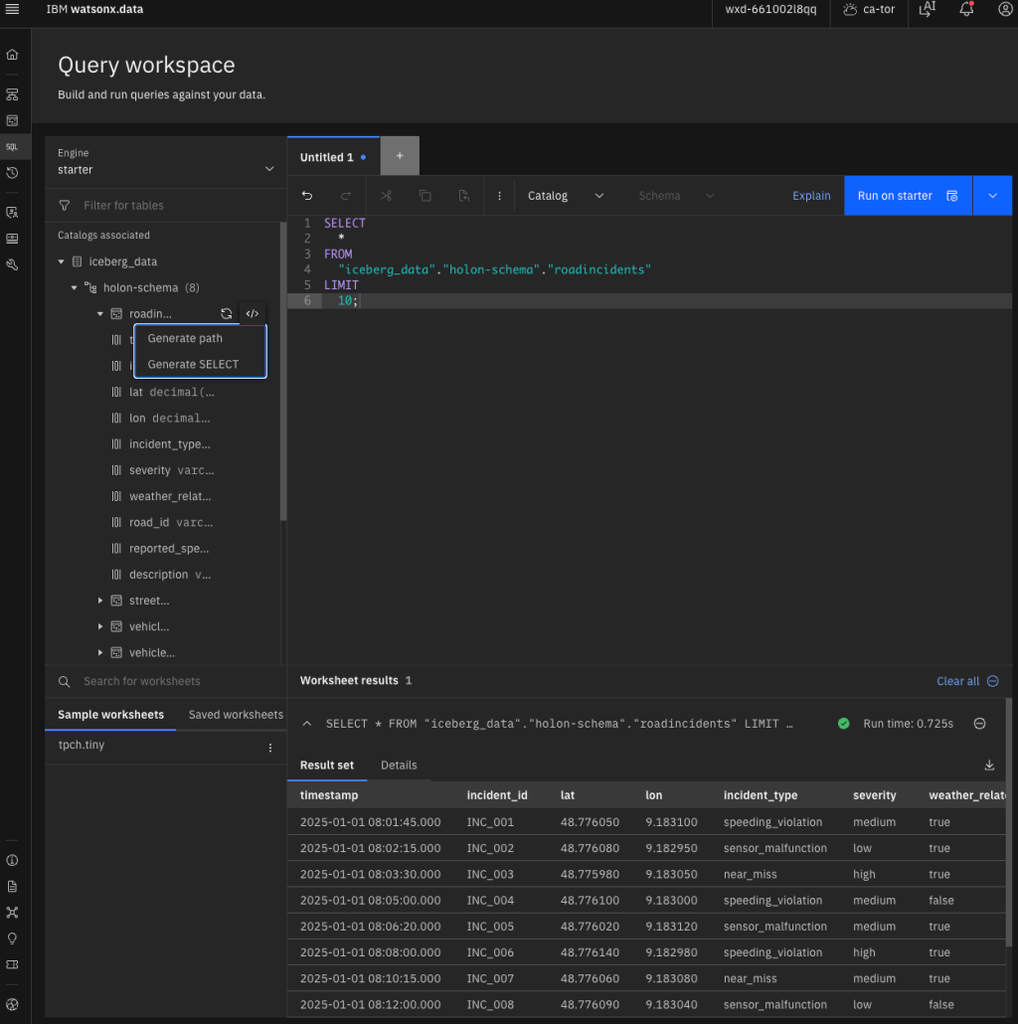
This allows users to seamlessly query data registered via Iceberg, independent of where the data physically resides.
Cross-Source Query Example
To demonstrate cross-source analytics, we run a more advanced SQL query that combines:
The goal is to associate each road incident with the nearest weather measurement before the incident occurred. (Query generated with the help of IBM Bob)
WITH weather_ranked AS (
    SELECT
        w.*,
        i.incident_id,
        i.timestamp AS incident_time,
        ROW_NUMBER() OVER (
            PARTITION BY i.incident_id
            ORDER BY ABS(date_diff('second', w.timestamp, i.timestamp))
        ) AS rn
    FROM iceberg_data."holon-schema".road_incidents i
    CROSS JOIN iceberg_data."holon-schema".weather w
    WHERE w.timestamp <= i.timestamp
)
SELECT
    i.incident_id,
    i.timestamp AS incident_time,
    i.incident_type,
    i.severity,
    i.reported_speed_kph,
    i.description,
    wr.timestamp AS weather_time,
    wr.condition,
    wr.rain_mm,
    wr.visibility_m
FROM iceberg_data."holon-schema".road_incidents i
LEFT JOIN weather_ranked wr ON
    i.incident_id = wr.incident_id
    AND wr.rn = 1
ORDER BY i.timestamp;
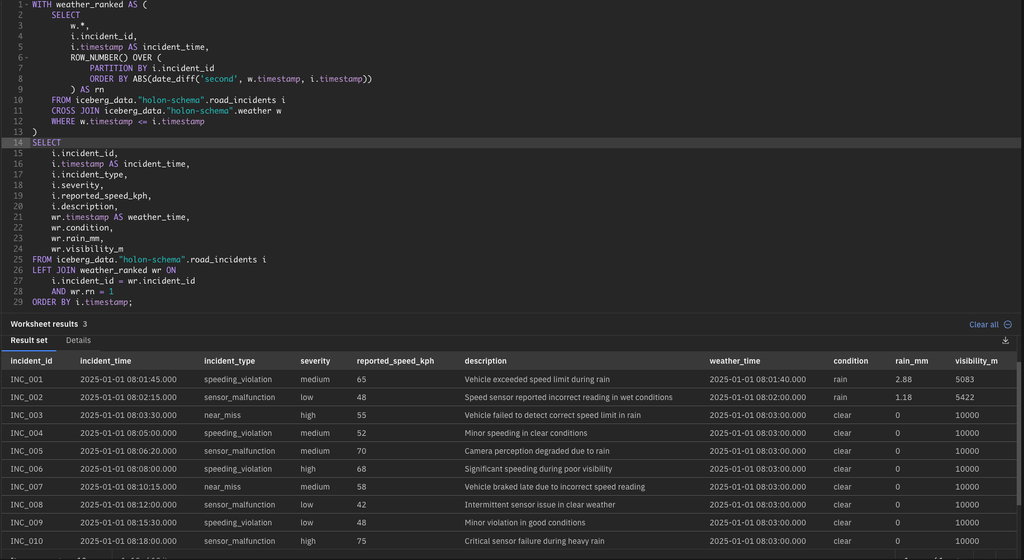
The query result demonstrates that:
-
Data from different sources (COS and Db2) can be queried in a single SQL statement
-
Each road incident is enriched with the closest preceding weather condition
-
Temporal correlation between events and contextual data is possible using SQL alone
-
Weather attributes such as rain and visibility are available for further analysis
This query could serve as a foundation for:
Presto enables interactive, cross-source SQL analytics in watsonx.data without moving data, powered by Iceberg and a unified metadata catalog.
Spark
While Presto SQL excels at fast, interactive querying and BI-style analytics, Apache Spark unlocks a broader data engineering and data science toolkit within watsonx.data. Where Presto is optimized for low-latency, ad-hoc queries, Spark is designed for large-scale, distributed batch processing that goes beyond declarative SQL. This makes it particularly well suited for:
• Advanced data transformations: Window functions over billions of rows,
complex aggregations with custom user-defined functions, or multi-pass data processing.
• Machine learning workflows: Training models with Spark MLlib, feature
engineering pipelines, or integrating with Python libraries like scikit-learn.
• Production ETL pipelines: Multi-stage transformations with checkpointing,
error handling, and data quality validation.
• Semi-structured data processing: Exploding nested JSON arrays, schema
evolution, or working with deeply nested Parquet files.
In practice, Presto and Spark are complementary rather than competing tools.
Many teams use Presto SQL for exploration, reporting, and interactive analysis,
while leveraging Spark for production-grade data pipelines, batch processing,
and machine learning workflows.
Spark Labs and Developer Experience
watsonx.data provides Spark Labs, a managed Spark environment that runs close to the data lakehouse. This eliminates the need to operate separate Spark infrastructure.
Spark Notebooks in watsonx.ai
You can run Spark notebooks in watsonx.ai by creating a new runtime that you can connect to your watsonx.data Spark engine (see here). The other option is to use Spark Labs.
Spark Labs
Although browser-based notebooks are convenient for quick experimentation, connecting Spark Labs to Visual Studio Code significantly improves the developer experience—especially for engineers and power users. By bridging Spark Labs with VS Code, you get the best of both worlds: the scalability and compute power of Spark running in watsonx.data, and the productivity of a modern development environment.
Remotely connecting VS Code to watsonx.data’s Spark environments is straight forward: https://www.ibm.com/docs/en/watsonxdata/standard/2.3.x?topic=experience-vs-code-development-environment-spark-labs
At a high level, the workflow is:
-
Create and start a Spark Lab in watsonx.data
-
Install the required VS Code extensions
-
Configure the Spark connection using provided endpoints and credentials
-
Execute Spark code from VS Code, running directly on the Spark Lab
This setup allows developers to use VS Code as their primary interface, while Spark execution and scaling are handled transparently by watsonx.data.
An example Spark notebook for processing the geospatial data can be found here: https://github.ibm.com/dennis-treder-tschechlov/watsonx-data-demo-self-driving-cars/blob/main/Spark_spatial_analysis.ipynb.
Geospatial Processing with Spark
Apache Spark in watsonx.data offers the specialized geospatial library pyst which enables advanced spatial analytics such as distance calculations, spatial joins, and geometry processing.
In this demo, we deliberately focused on core Spark and SQL capabilities to keep the setup lightweight and easy to reproduce. While we evaluated integrating a dedicated Spark-based geospatial library, we were not able to run it successfully within the available TechZone environment during the demo preparation phase.
In customer setups, the geospatial Spark library could be added to enable more advanced spatial analytics on the same lakehouse data—without changing the underlying ingestion, catalog, or governance architecture. For more details on supported geospatial libraries in watsonx.data, see the official documentation:
https://www.ibm.com/docs/de/watsonxdata/standard/2.3.x?topic=libraries-geospatial-data-analysis
Data Quality and Profiling with watsonx.data Intelligence
To showcase data quality and enrichment capabilities, we worked directly in the Cloud Pak for Data (CP4D) project view, rather than the default DataStage view, which does not expose the full set of watsonx.data intelligence features. From there, we created a dedicated project to host all data assets, quality rules, and outputs.
Making Lakehouse Data Available in the Project
The data itself already lived in watsonx.data as Iceberg tables. To make these tables available for profiling and quality checks, we first created a connector asset inside the project:
-
Create a new Connection asset
-
Select watsonx.data (Presto) as the connector type
-
Upload the Presto connection JSON
The JSON can be exported directly from watsonx.data via
☰ Menu → Configurations → Connection information → IBM Products → Presto Engine → Export JSON.
This same JSON is reused to create the connection asset in the project.
Once the connection exists, the data can be imported:
-
From the project asset view, select Import assets
-
Choose the Presto connector
-
Browse available schemas and Iceberg tables
-
Select and import the relevant tables
After import, the tables appear as relational table assets within the project and can be directly profiled and analyzed.
Profiling the Vehicle Telemetry Data
For the demo, we selected one of the vehicle telemetry tables and opened it in the asset view. From there, three main tabs are available: Profile, Data Quality, and Visualization.
Under Profile, profiling is triggered manually by clicking Profile data. The initial run takes a short while, as metadata and statistics are computed.
Once complete, the profile provides:
-
Automatically inferred data types
-
Column‑level statistics (range, distribution, uniqueness)
-
Null and completeness indicators
-
Natural‑language column descriptions, generated automatically
-
Value distributions that immediately highlight outliers and anomalies
This gives a fast, high‑level understanding of the dataset without writing a single query.
Data Quality Overview and Metadata Enrichment
The next step is the Data Quality tab. Before quality metrics are available, a metadata enrichment needs to be created. This step also runs once initially and enriches the dataset with semantic metadata.
After enrichment, the data quality dashboard shows:
-
Overall data quality score
-
Checks for nulls, uniqueness, and consistency
-
Trends over time as rules are re‑evaluated
-
Integration of both built‑in and custom quality rules
The framework also supports SLA definitions that can be uploaded and evaluated against the data, although this was not part of the demo.
Visual Exploration
From the Visualization tab, simple charts can be created directly on top of the dataset. For the demo, we generated an on‑the‑fly visualization of vehicle speed over time to quickly validate assumptions surfaced during profiling and quality checks.
Semantic Context: Business Terms and Data Classes
To improve profiling and quality results, we added domain knowledge via Business Terms and Data Classes, accessible from the Governance section in the hamburger menu.
-
Business Terms provide semantic explanations for complex or cryptic fields and allow related columns to be grouped under a common meaning.
-
Data Classes define technical characteristics such as expected data types, value ranges, and synonyms.
For example, we defined a Speed data class using natural language:
These definitions are automatically taken into account during metadata enrichment and subsequent quality checks.
Custom Data Quality Rules
Beyond built‑in checks, watsonx.data intelligence supports custom data quality rules for domain‑specific logic.
We demonstrated two types of rules:
-
Simple rules, such as flagging vehicle speeds above a defined threshold
-
Relational rules involving joins across datasets
A more advanced example joined vehicle telemetry with the street sign dataset via sign_id and checked whether the detected speed limit matched the actual sign value. While not strictly “bad data,” such mismatches represent anomalies that are critical to surface in an autonomous driving context.
Rule creation happens in two steps:
-
Define a data quality definition, including relationships and conditions
-
Create the rule, where:
Persisting and Scheduling Quality Results
To persist rule results, we configured a DB2 connection as an output target. This allows rows that fail quality checks to be written to a physical table.
Additional context columns (e.g. timestamp, vehicle ID) can be included in the output for downstream analysis.
Rules can be:
The resulting output tables appear as regular assets in the project and can be further analyzed, visualized, or consumed by other systems.
watsonx.data Intelligence enables profiling, semantic enrichment, and both simple and relational data quality checks directly on lakehouse data—without data movement and tightly integrated with analytics workflows.
Adapting the Demo to Other Use Cases
The demo setup is intentionally designed to be reproducible and extensible. The same structure can be recreated in another environment or adapted to different use cases, data sources, or business domains with minimal changes. The same setup can easily be adapted by changing only a few components:
-
Data sources
-
Replace synthetic data with domain-specific or even real customer datasets
-
Add additional sources such as other databases, object stores, or streams
-
Schemas and catalogs
-
Analytics logic
-
Governance rules
Typical Adaptation Scenarios
The same blueprint applies to a wide range of use cases, for example:
-
Manufacturing sensor data and quality monitoring
-
Financial transaction analysis and compliance checks
-
Retail sales, inventory, and demand analytics
-
Energy, IoT, or logistics datasets with time‑series characteristics
This flexibility makes the demo a practical starting point for other use cases / domains.
Summary
In this post, we walked through an end‑to‑end demo built on watsonx.data, demonstrating how distributed data can be integrated, analyzed, and governed using a modern lakehouse architecture. Starting from heterogeneous data in cloud object storage and databases, we showed how watsonx.data Integration, the watsonx.data Lakehouse, and watsonx.data Intelligence work together as a unified platform. The demo illustrated zero‑copy access via Apache Iceberg, interactive cross‑source SQL analytics with Presto, scalable processing with Spark, and integrated profiling, semantic enrichment, and data quality checks—directly on lakehouse data and without additional data movement.
While the demo is based on an autonomous driving scenario, the underlying architecture and workflows are industry‑agnostic. They provide a reusable blueprint for organizations looking to modernize their data platforms, reduce complexity, and enable governed analytics across disparate data sources.
Overall, the demo illustrates how watsonx.data brings together performance, flexibility, and governance—turning distributed data landscapes into analytics‑ready foundations for trusted decision making.
#watsonx.data#PrestoEngine#Catalog#Bucket#Db2Connector-Presto