This reference blog documents every metric group collected by the IBM Storage Virtualize Management Pack. For each resource type, we list the metric key, its display name (from the English resource bundle), unit, data type, and how it is calculated. Use this as a definitive reference for understanding the data behind the dashboards and reports.
🗄 IBMSVCInstance — System Metrics
Delta calculation: All Nv_stats metrics except rlw, wlw, ulw, tmaxdelay are DELTA (new value − old value across consecutive 5-min files). rlw, wlw, ulw, tmaxdelay are LATEST (reset each interval — worst-case values since last collection). Multi-node aggregation uses sum for deltas and max for peak latency.
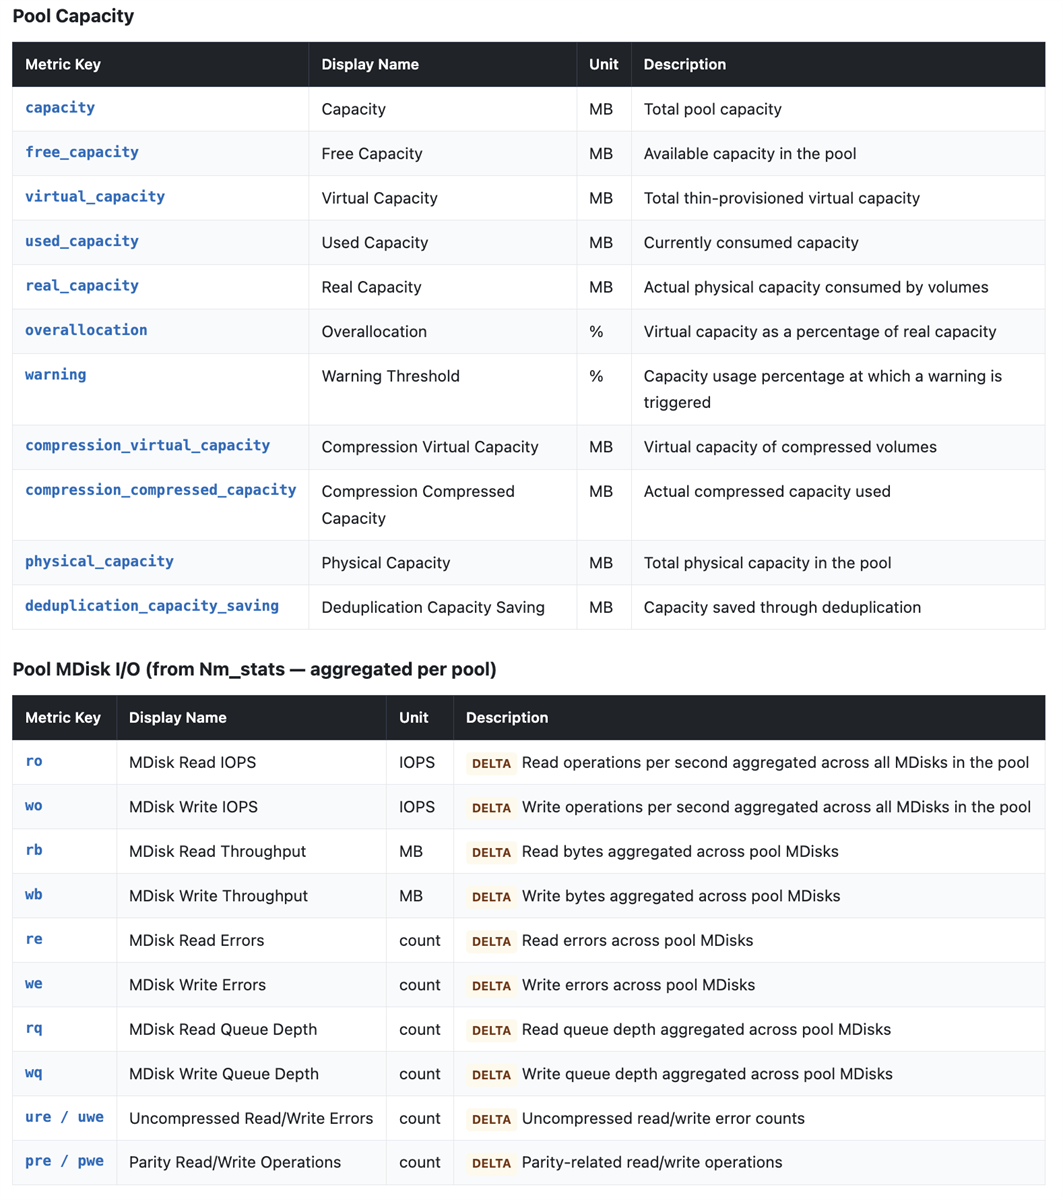
🪣Pool & ChildPool Metrics
MDisk stats (Nm_stats): The adapter maps MDisks to their parent pool via lsmdisk, downloads Nm_stats files, computes DELTA per MDisk, and sums across all MDisks in each pool to produce pool-level aggregates.
Unit conversions: Byte metrics (hbt, hbr, cbt, cbr, lnbt, lnbr, rmbt, rmbr) are
DELTA calculated then divided by 1,048,576 to convert bytes → MB. Other metrics are either
DELTA or
LATEST as noted.
Metric Accuracy and Timestamp Notes
- Timestamp anchoring: The SystemCollector calls
lssystemstats at the start of each cycle and caches the sample_epoch (epoch seconds → milliseconds). All collectors that lack their own file timestamps use this cached value as fallback — ensuring all metrics in a single cycle share a consistent time anchor.
- Calculated interval: For all stat file pipelines (Nv, Nh, Nn, Nm, Nd), the interval is calculated as the difference between the timestamps of the two downloaded files (new − old) in seconds, rather than using a hardcoded 300s constant. This handles cases where collection was delayed or the FlashSystem regenerated files at a non-standard interval.
- Counter rollover: For HostPort FPIN metrics (lin, pcn), if the new value is less than the old value (counter rollover), the adapter uses the new value directly rather than a negative delta.
- Multi-node aggregation: IBM FlashSystem generates one stats file per node (panel). The adapter downloads files from all nodes and merges them: cumulative counters are summed, while peak latency metrics (rlw, wlw, tmaxdelay) take the maximum value across nodes.
For any queries feel free to contact: