IBM Blueworks Live is your front door to digital transformation with the IBM Cloud Pak for Business Automation. The digital transformation journey starts with the Gather phase and continues with the Assess phase, where the focus is on validating the current business operations model and analyzing it against the business goals and pain points, and then identifying potential “what if?” scenarios for improvements to analyze and play back. In the seventh posting of this series of articles we introduced some guidance for finding problems within the process. In this posting, we will expand upon that topic to discuss best practices for analyzing your process and playing back different scenarios for progressing your transformation initiatives. This article explains how to utilize the Analysis mode to gain further insights, analyze the process, address problems, and quantify KPIs.
Preparing for Process Analysis
Process analysis is a key step in business transformation and process improvement. You can’t improve what you don’t know. To productively utilize the Analysis mode to validate, analyze and identify opportunities for improvement, process and activity details should be filled out as completely as possible. This is an iterative and agile exercise, so over documentation is discouraged, but the more activity details are provided, the better the analysis insights will be. Process and activity characteristics are added to the Details page during collaborative discovery workshops, as described in this previous article. Once enough documentation has been provided in the Gather phase, the Assess phase and processes analysis can begin.
Assess – Validate and Analyze with Analysis Mode
Start assessing the current process to validate, quantify metrics and find opportunities for transformation. This exercise also ensures you have collected the relevant details of the process. Within Blueworks Live, select the Analyze feature at the top right of the diagram. This will switch the display to the Analysis mode, where you can overlay process parameters and create heat maps. For more information on heat maps, please review this article.
Similar to the Gather phase, this exercise in the Assess phase is best delivered collaboratively between business and IT. You will want to leverage the assembled team described in article two of this series, and follow best practices for collaborative workshops outlined in article four.
Once the team has gathered and Analysis mode has been enabled, you can toggle between different parameters to get a better view of the process. It is recommended to start with problems (pain points), value add, cycle time and cost. The details for these KPIs are most commonly documented, and often provide insight into the effectiveness and efficiency of a process. Identifying bottlenecks, where time and cost are accumulating, activities in the flow that do not add value, and areas of the process with large concentrations of problems, or those of high frequency or severity, give transparency to key insights and opportunities for improvement. Figure 1 below shows how you can enable the Analysis mode and select different parameters to visualize, both in the process diagram and discovery map.
Figure 1: Analysis Mode

Collaborate with the team over findings, dive into root causes and experiment with different parameters and scenarios, following both happy and exception paths, to uncover additional opportunities for improvement. From here, you can begin building a backlog of transformation ideas, quantify cost-benefit analysis and prioritize the opportunities for an MVP.
Playback
Another important part to the Assess phase are playbacks, both as-is and what-if process scenarios. Once you have an idea where process problems, bottlenecks and cost-adding activities exist through the Analysis mode, you can design and playback different process scenarios to better understand root causes. Not only can you create different scenarios following various process paths, but you can also track key metrics along the way to see how each scenario impacts your most important KPIs. Monitoring problems, cycle time, cost and other parameters through the playback Analysis feature provides key insights you can use for transformation. Create playback scenarios by selecting the Playback feature at the top right of the page. Figure 2 and 3 below shows how you enable the Playback mode and begin creating scenarios.
Figure 2: Playback View

Figure 3: Playback Scenarios
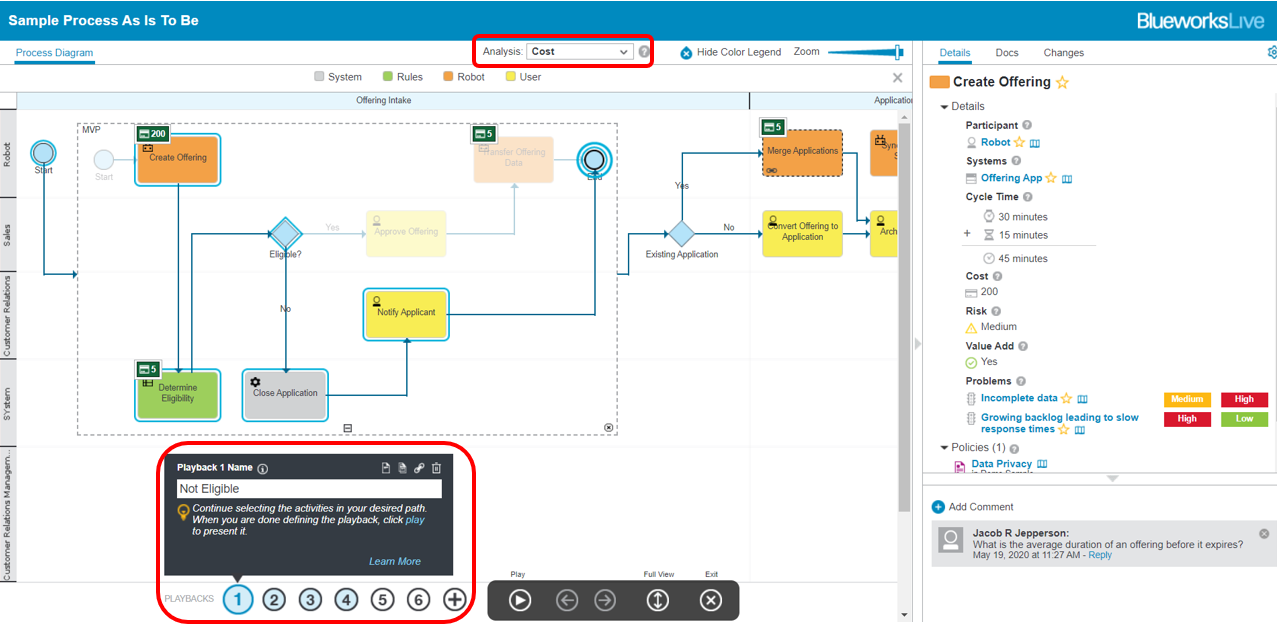
Once in Playback mode, begin creating scenarios by providing a unique name and selecting the process activities you want to follow. As you continue selecting activities and progressing through the process, you can navigate different paths depending on your scenario. These paths are determined by choosing decision gateway outcomes and selecting eligible activities highlighted along that path. Once the scenario is defined, you can click Play to playback and walkthrough each activity in the process flow. Select the KPI in the Analysis drop down to track the metric as you progress through the process. Furthermore, as you step through the process flow, each activity is highlighted in the right panel. Activity details, documents, interactive comments and a change log are shown to provide a 360 degree view of the process. This is critical for the team to gain an understanding and consensus of the process, identify root causes and prioritize improvement opportunities. Figure 4 shows how you playback a scenario, walk through each activity in that path and track the analyzed KPI.
Figure 4: Playback Mode

In this case shown above, cost was the analyzed KPI, and this scenario generated 205 units of cost. Also, the activity details panel on the right confirms the pain points and time delays in the Notify Applicant activity. You can compare and contrast process scenarios through the Playback mode by using the Analysis feature to highlight different KPIs, such as total cost, cycle time, problems and more. Each scenario will provide a KPI result you can use to differentiate and prioritize the scenarios and potential improvements.
In this article we introduced some approaches in the Assess phase to validate, analyze and playback process scenarios to find opportunities for transformation. We also shared recommendations for which process parameters and metrics can be used to drive the most improvement. In our next posting, we’ll discuss what to do with these analysis and playback results, and how to begin process transformation for continuous improvement.
#BlueworksLive#processmodeling#processdiscovery