Recently I was having some deep dive conversations with a customer analyzing the performance of Watson AIOps Metric Manager (formerly Predictive Insights). The customer raised a lot of questions that I have answered many times before, but they are worth re-iterating here.
The aim of Metric Manager is to learn the normal pattern of behaviour of a timeseries and raise an event when it changes significantly. It will do this without requiring any configuration or tuning.
Metric Manager achieves this through a suite of anomaly detection algorithms - one of which produces a baseline. This anomaly detection algorithm resonates well with customers because it is a familiar concept, and a visual baseline helps with explainability. If a value is outside the baseline it must be anomalous.
Simple!
Our baselining algorithm looks for typical values at specific times of the day or times of the week, to understand the normal behaviour. For example, if employee logins were measured, we would observe that the number increases at the start of the work day, and trend downwards at the end of the day. On weekends, the traffic is minimal. Our algorithm will learn all of those behaviours. So, if on Monday morning you do not have as many logins as normal, the algorithm will raise an anomaly. In one customer, we saw this exact scenario when a patch was installed over the weekend and the last step required in the process was missed. This meant some customers could log in, but most could not!
Sometimes, however, our baselining algorithm decides that a timeseries is not suitable for it as it will generate too much noise. That means that it will not produce a baseline. This can happen in one of the following two scenarios:
- the algorithm determines that the timeseries lacks features or qualities that are suitable. This is by design. We have always held a “use case first” mantra for our algorithms. This means that the algorithms are built to solve a clear problem, and are not just “fishing” to solve generic problems. If the algorithm knows it is not good at detecting anomalies in certain types of timeseries, they will not be analysed
- the model produced has to pass through a validation phase that can ensure the model is not generating noise. The algorithm can adjust its parameters and choose to re-validate many, many times, but will abandon if unsuccessful
Let me emphasize again: both of these steps are performed automatically without user intervention. In fact, most of our users do not know this happens at all. And why should they? Our users are typically not data scientists, and care more about resolving issues before they become service-impacting rather than how we actually do it.
(OK, We Actually Have Two Baseline Algorithms)
If a timeseries is not suitable, or doesn’t pass validation, we revert to another baseline algorithm which does not raise anomalies. Internally, we call this algorithm “naïve baseline” as it relies on fewer features, and does the best job it can with the data it has.
The good points of naïve baseline is that it allows us to continue our visual representation of a baseline in the chart, and it can start producing a baseline after just a few data points. The downside is that if a value is outside the visual baseline, it is not always anomalous. We’re working on improving naïve baseline so that it can raise anomalies. That would help us analyse timeseries that are short-lived and more prevalent in the cloud world where pods can scale up and down.
Tight versus Wide Baselines
Mathematically speaking, the baseline that gets created is the best possible baseline. It has been tuned automatically so that it will not produce too many anomaly events, and also to ensure it doesn’t overfit the data (the danger of overfitting is that it will never produce an anomaly). Sometimes the baseline is bigger and wider than a customer expects. If a value at a specific time is always the same, our baseline will learn this and create a baseline that “tightly” fits the data at that time. If the range of values at a given time varies a lot, the baseline will widen.
The important thing to remember here is that baselines are one method to detect anomalies. We have a suite of algorithms to find anomalies that can occur inside the baseline. By not forcing our baseline algorithm to tightly fit the data when it doesn’t make sense to do so, we can ensure we do not generate noise.
Improving with Customer Feedback
If a customer ever sees something they do not understand, or finds an anomaly that our suite of algorithms did not detect, they can export the data and send it to us. This can be done via the export button on our UI. This helps us develop new anomaly detection algorithms that can be added to our suite, or added to our test harness. It can also help us improve our explainability of why we did not flag that issue.
The Best Baselining Algorithm
The Metric Manager baselining algorithm solves a clear problem for a specific set of timeseries. It can self-tune per timeseries and validate itself, which means the cost of ownership is small. The algorithm is also scalable, and our cloud-native version (currently in development) is looking even more promising.
By incorporating the baselining algorithm as part of a broader suite of algorithms we do not need to over rely on it, which means less noise, and better insights.
Examples

An early naïve baseline transitioning to Robust baseline as more features are learned.
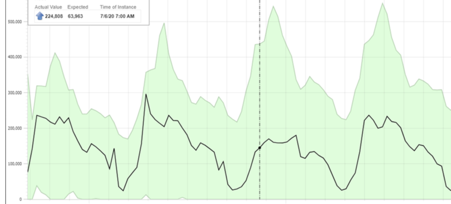
Baseline widening as learned ranges of values increases.